Boxplots (SQA National 5 Applications of Mathematics): Revision Note
Exam code: X844 75

Boxplots
What are boxplots?
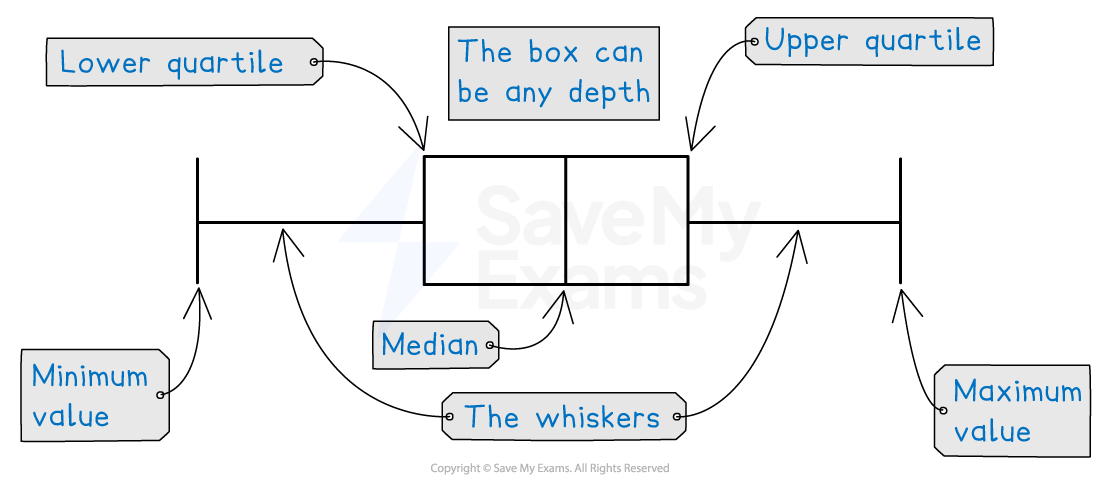
A boxplot is a diagram that clearly shows key statistics from a data set
It shows the median, the quartiles, and the minimum and maximum values
It does not show any other individual data items
The middle 50% of the data is represented by a box
The lower and upper 25% of the data are each represented by "whiskers"
Examiner Tips and Tricks
Some exam questions write the word boxplot as two words, box plot. Both are correct.
How do I draw a boxplot?
You need to draw vertical lines at the following five values
Lowest data value
Lower quartile
Median
Upper quartile
Highest data value
Draw a rectangle using the lines for the upper and lower quartiles as two of the sides
This is the middle 50%
Draw a horizontal line from the box to the lowest value
This is the lowest 25%
Draw a horizontal line from the box to the highest value
This is the highest 25%
How do I interpret a boxplot?
You can read off the five values
You can calculate the range and interquartile range (IQR)
range = highest value - lowest value
interquartile range = upper quartile - lower quartile
Worked Example
The incomplete box plot below shows the tail lengths in cm of some students’ pets.
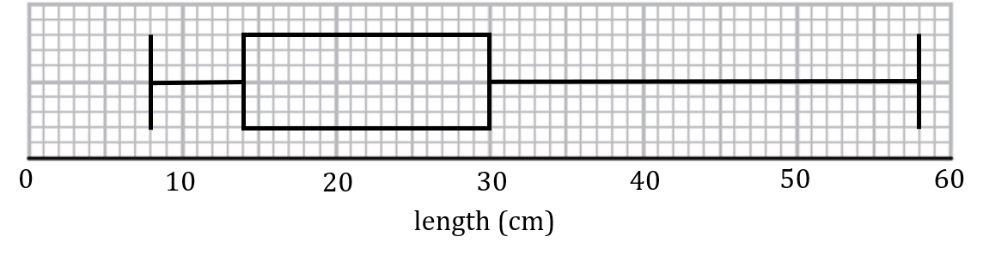
(a) Given that the median tail length was 21 cm, complete the box plot.
(b) Find the range and interquartile range of the tail lengths.
Answer:
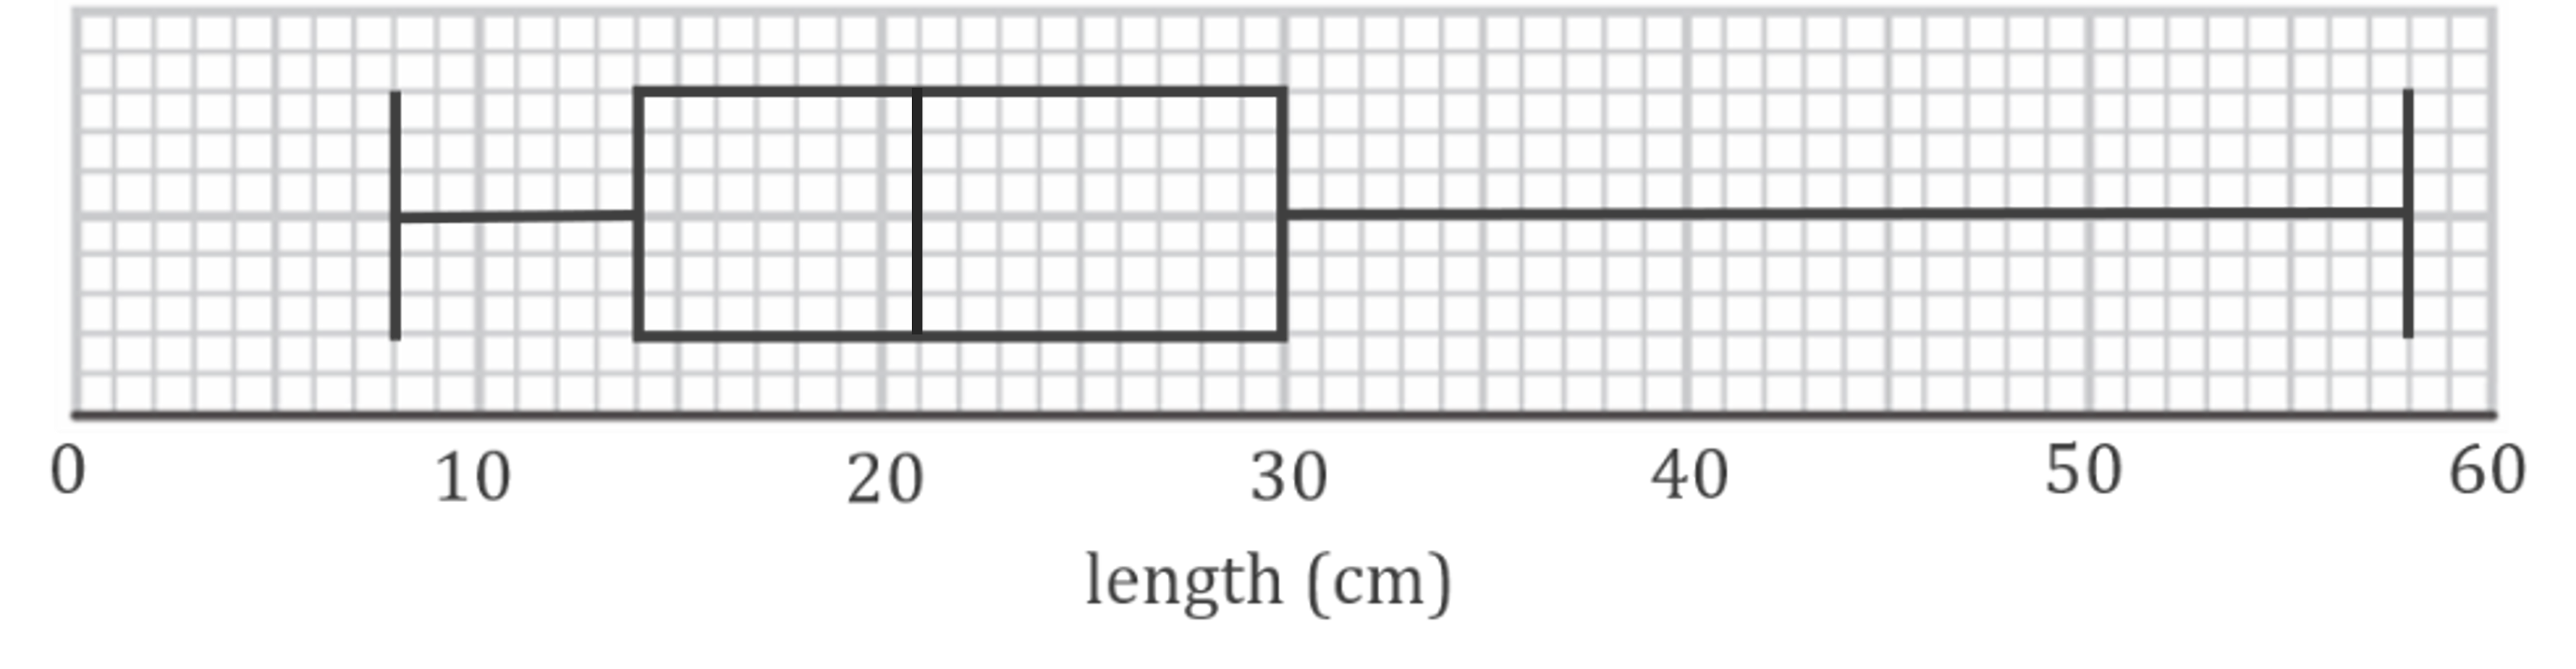
(a)
(b)
Find the range by subtracting the lowest value from the highest value
![]()
Range = 50 cm
Find the interquartile range by subtracting the lower quartile from the upper quartile
![]()
Interquartile range = 16 cm

Unlock more, it's free!
Join the 100,000+ Students that ❤️ Save My Exams
the (exam) results speak for themselves:

Was this revision note helpful?
