Scattergraphs (SQA National 5 Applications of Mathematics): Revision Note
Exam code: X844 75

Scattergraphs
How do I complete a scattergraph?
Scattergraphs (sometimes called scatter diagrams or scatter plots) are used to plot pairs of data
e.g. students' Maths grades against their Physics grades
The vertical and horizontal axes represent the two quantities being measured
For each pair of data:
find the correct value on the horizontal axis
find the correct value on the vertical axis
mark the point that is in line with both values
Examiner Tips and Tricks
Do not join up the points on a scattergraph.
How do I draw a line of best fit?
A line of best fit is a straight line drawn through a scattergraph
It shows the overall direction of the data
It represents the best estimate of the relationship between the two variables
The start of the line should be vertically in line with the leftmost point
It does not have to start at this point
The end of the line should be vertically in line with the rightmost point
It does not have to end at this point
The line should be as close to as many points as possible
It does not have to actually pass through any of the points
There should be points above and below the line
Examiner Tips and Tricks
Do not be tempted to make your line of best fit start at the origin. You normally lose a mark if your line goes through the origin.
How do I use a line of best fit to estimate values?
You will be given the value of one of the variables
e.g. you might be given the Maths grade
You will have to use the line of best fit to estimate the value of the other variable
Draw a horizontal or vertical line from the given value on the appropriate axis to the line of best fit
Draw a vertical or horizontal line from the point on the line of best fit to the other axis
Read off the value
Pay attention to the scale
Worked Example
A teacher is interested in the relationship between the number of hours her students spend on a phone per day and the number of hours they spend on a computer. She takes a sample of nine students and records the results in the table below.
Hours spent on a phone per day | 3.8 | 3.5 | 4.4 | 1.5 | 1.5 | 3.7 | 1.1 | 0.6 | 2.9 |
Hours spent on a computer per day | 0.8 | 0.5 | 0.3 | 2.9 | 2.6 | 1.8 | 3.4 | 3.5 | 1.6 |
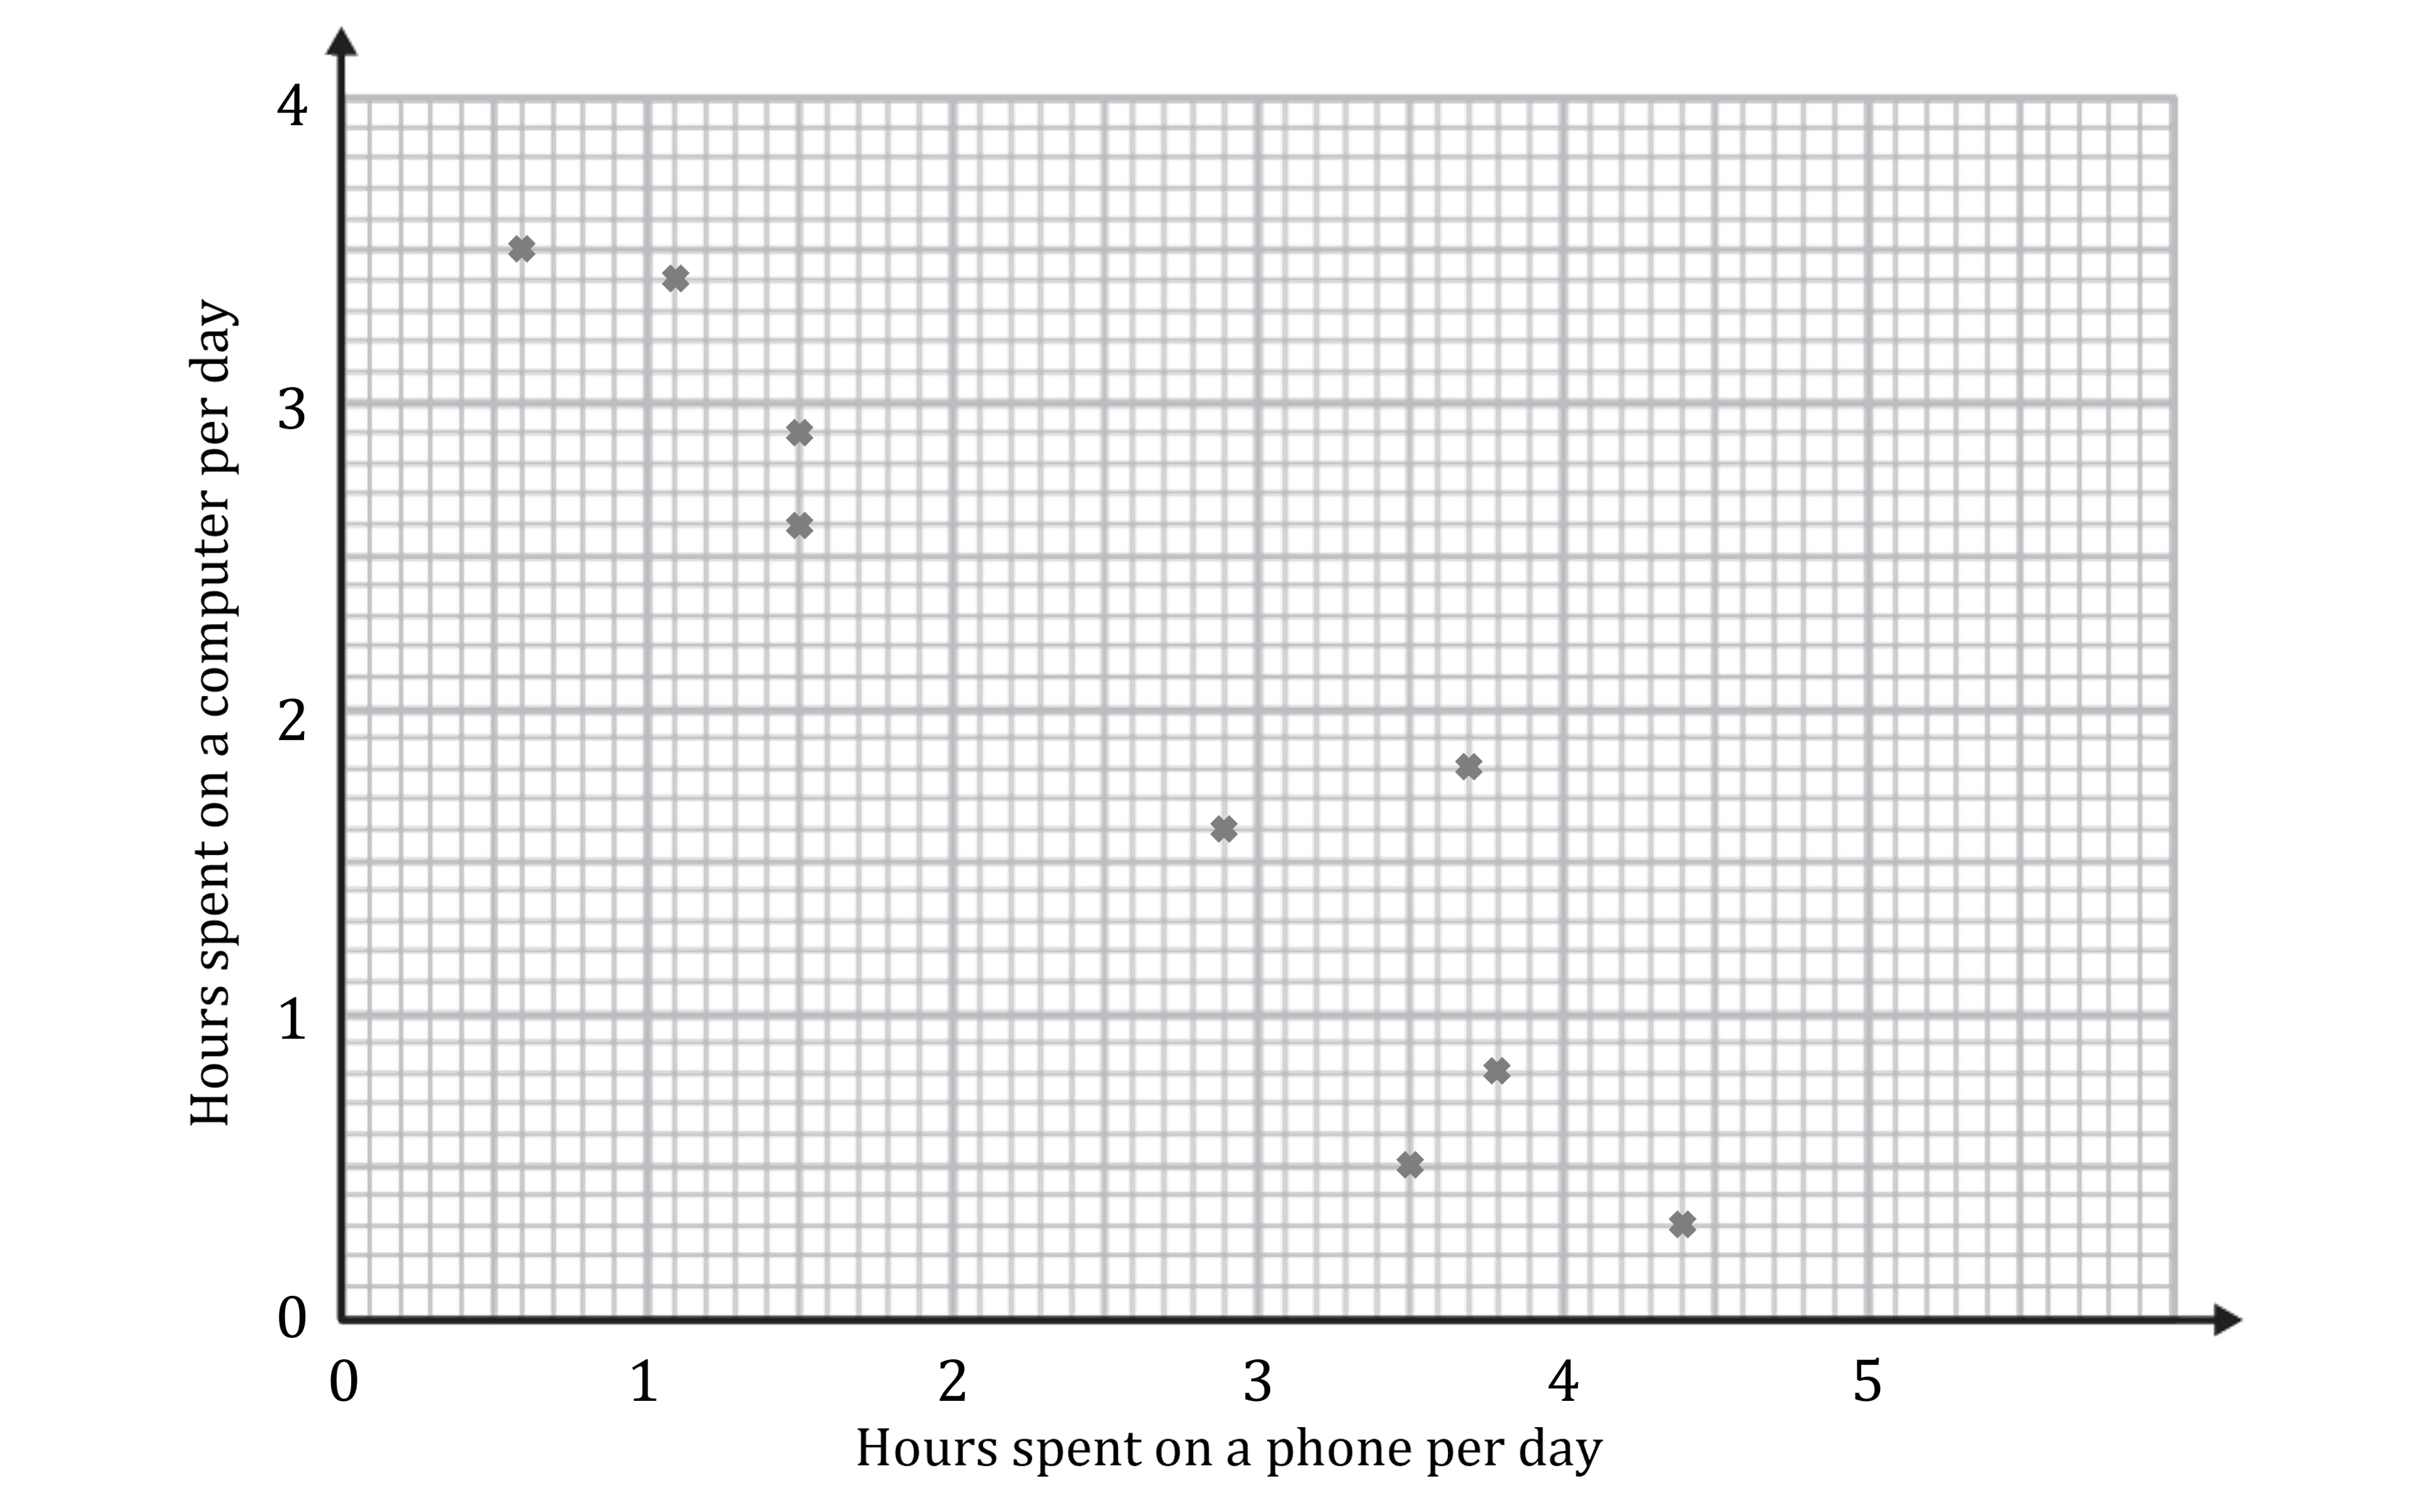
(a) Draw a scattergraph to show this data.

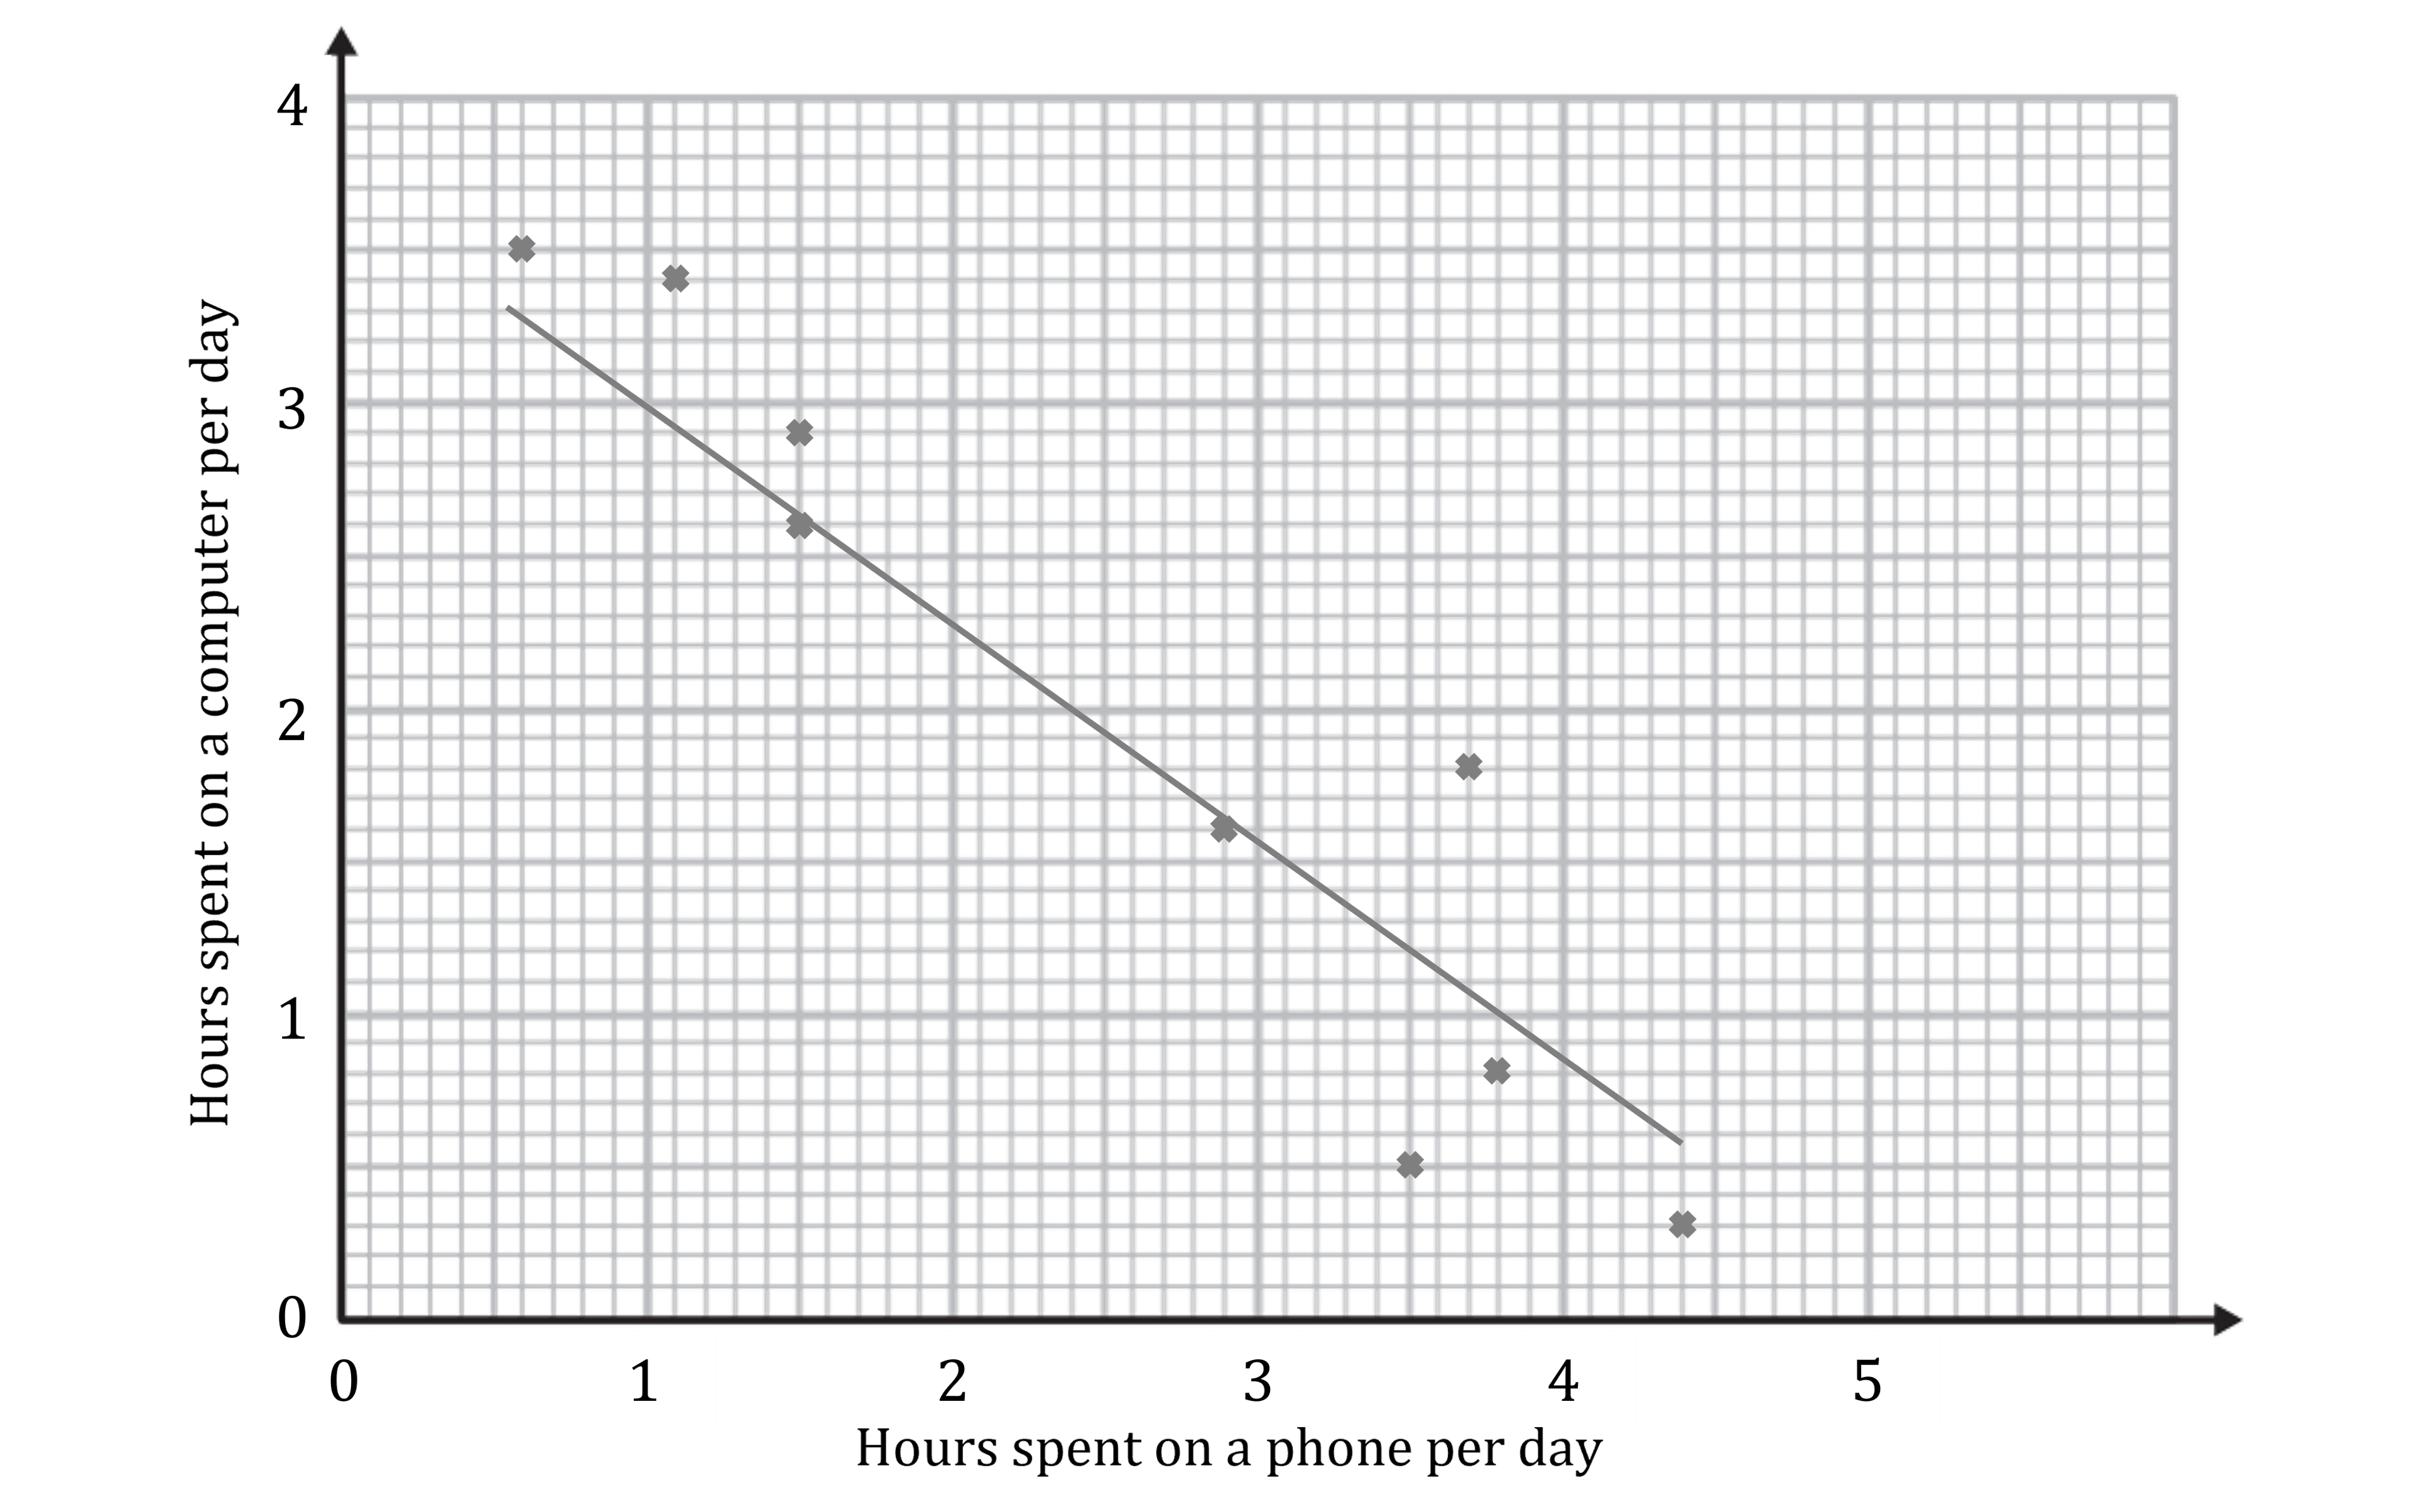
(b) Draw a line of best fit on your scattergraph.
(c) Another student spends 2.4 hours per day on a phone. Use your line of best fit to estimate how long this student spends on a computer per day.
Answer:
(a)
Plot a point for each pair of values
(b)
Draw a line of best fit
starting for 0.6 hours spent on a phone per day
ending at 4.4 hours spent on a phone per day
make sure there are points above and below the line
(c)
Estimate the value
Draw a vertical line from 2.4
Then draw a horizontal line to the axis
Read off the number
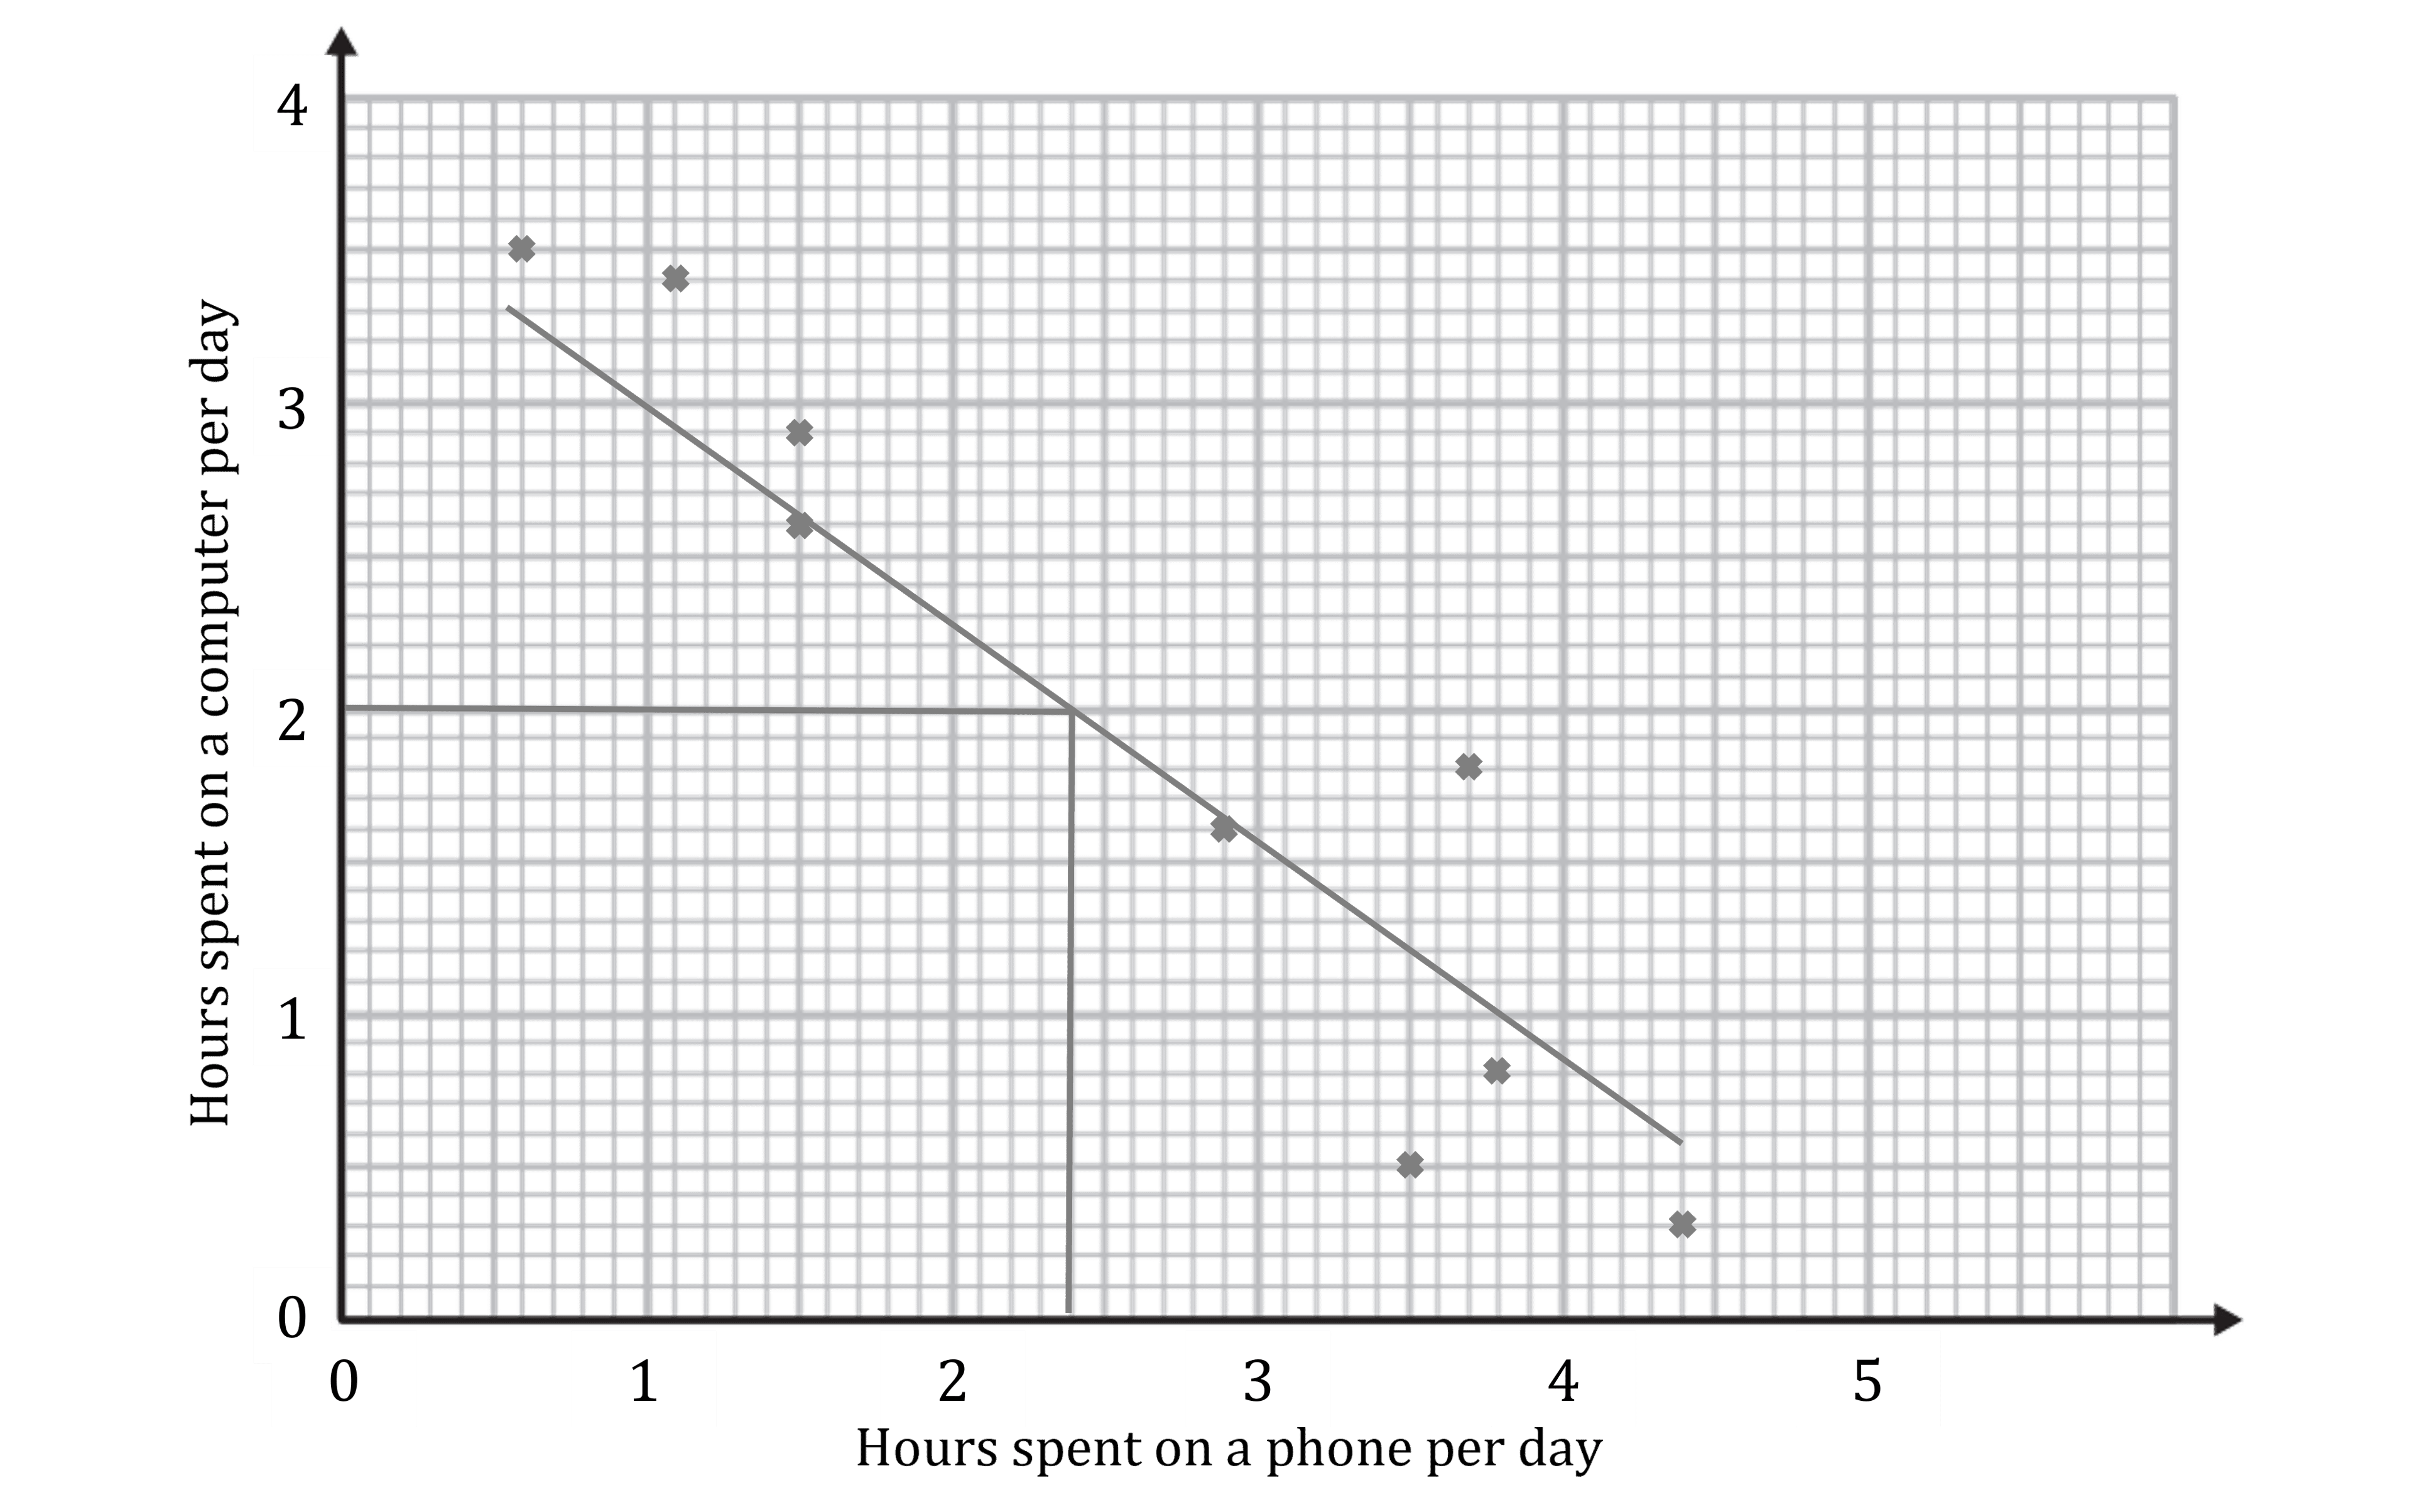
2.0 hours

Unlock more, it's free!
Join the 100,000+ Students that ❤️ Save My Exams
the (exam) results speak for themselves:

Was this revision note helpful?
