Velocity–Time Graphs (SQA National 5 Physics): Revision Note

Exam code: X857 75

Katie M

Written by: Katie M

Reviewed by: Leander Oates

Updated on

Velocity-time graphs

  • Speed-time graphs and velocity-time graphs are used to describe the motion of an object

    • Speed, or velocity, is always plotted on the vertical axis (y-axis) as it is the dependent variable

    • Time is always plotted on the horizontal axis (x-axis) as it is the independent variable

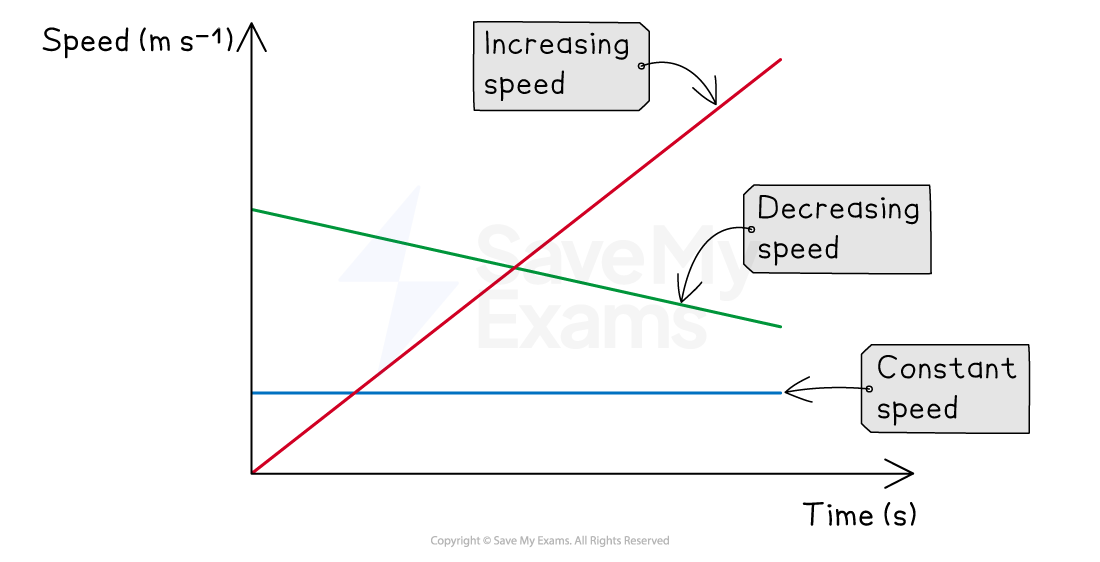
  • A speed-time graph shows how the speed of an object varies with time

    • Since speed is a scalar quantity, the values of speed will always be positive

Speed-time graph for different objects

Graph showing speed over time with three lines: red for increasing speed, green for decreasing speed, and blue for constant speed.
The red line represents an object with increasing speed, the green line represents an object with decreasing speed, and the blue line represents an object with constant speed
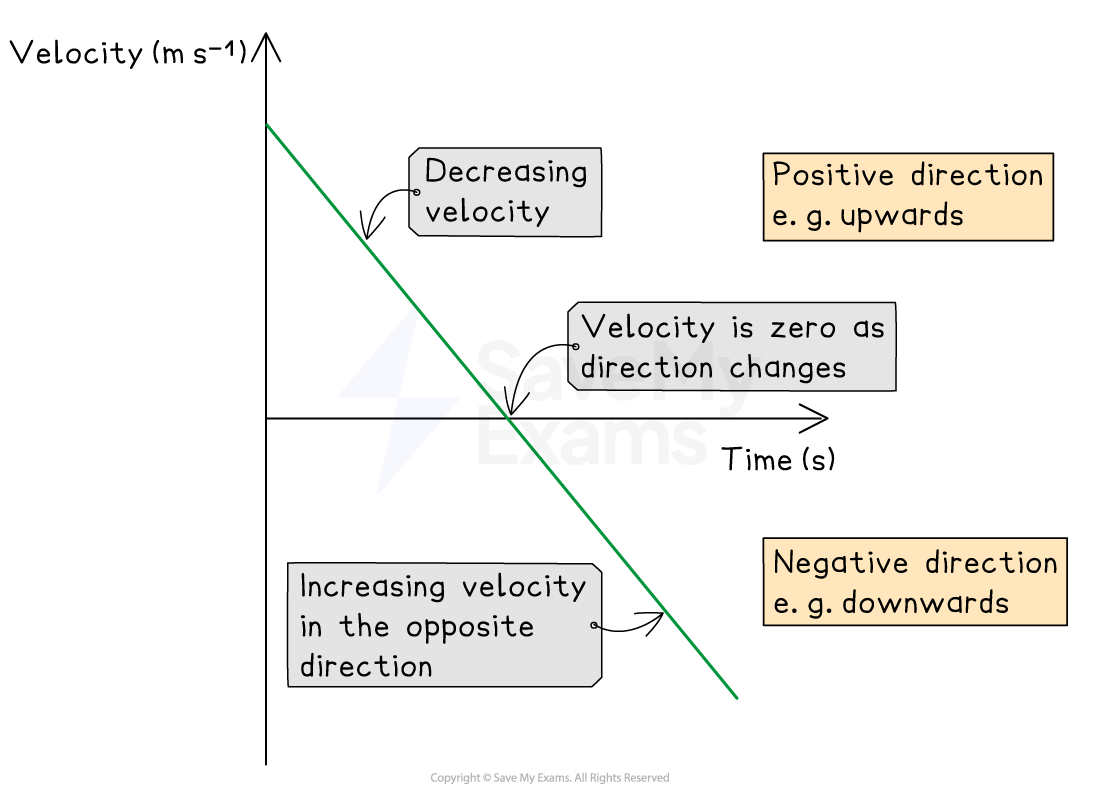
  • A velocity-time graph shows how the velocity of an object varies with time

    • This looks very similar to a speed-time graph, but since velocity is a vector quantity, the values of velocity may be positive or negative to indicate direction

Velocity-time graph for a ball thrown upwards

Graph showing velocity against time with annotations: decreasing velocity, zero velocity at direction change, and increasing velocity in the opposite direction.
When a ball is thrown upwards, its velocity decreases until it reaches the highest point, then changes direction. The velocity then increases in the opposite direction as the ball falls back toward the ground

Interpreting velocity-time graphs

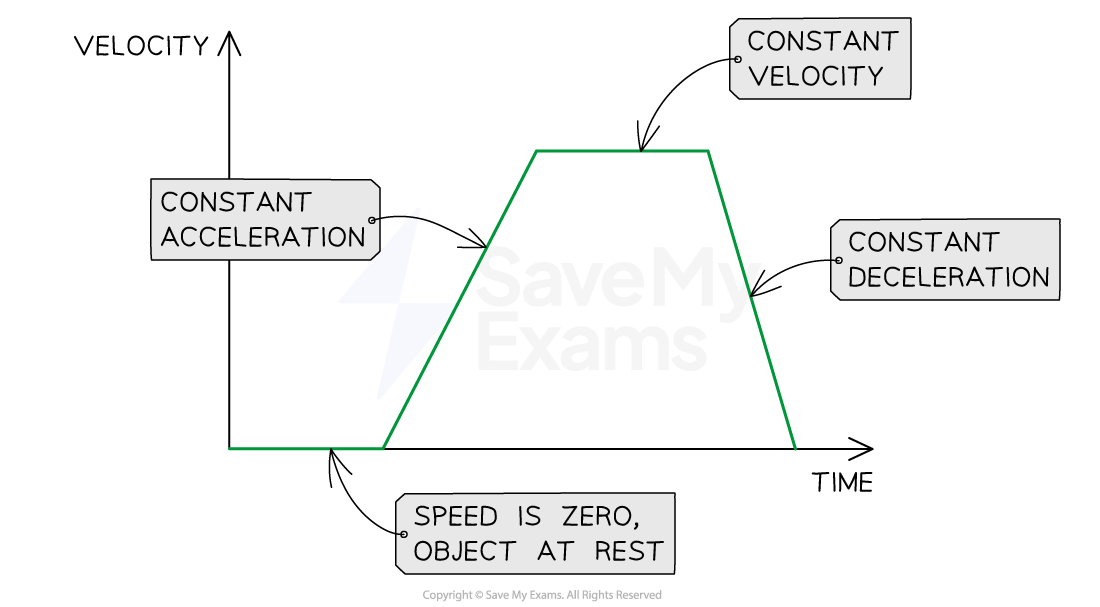
  • The slope of the line on a velocity-time graph represents the magnitude of acceleration

    • The steeper the slope, the larger the acceleration

      • The object's speed changes very quickly

    • The shallower the slope, the smaller the acceleration

      • The object's speed changes very gradually

    • A positive slope indicates increasing velocity

      • The object is accelerating

    • A negative slope indicates decreasing velocity

      • The object is decelerating

    • A horizontal (flat) line means the acceleration is zero

      • The object is moving with a constant velocity

Constant acceleration and constant velocity on a velocity-time graph

Graph showing velocity-time with phases: constant acceleration, constant velocity, constant deceleration, and object at rest; labelled arrows.
Flat horizontal lines on a velocity-time graph show periods of constant velocity, and sloping straight lines show periods of acceleration

Unlock more, it's free!

Join the 100,000+ Students that ❤️ Save My Exams

the (exam) results speak for themselves:

Katie M

Author: Katie M

Expertise: Physics Content Creator

Katie has always been passionate about the sciences, and completed a degree in Astrophysics at Sheffield University. She decided that she wanted to inspire other young people, so moved to Bristol to complete a PGCE in Secondary Science. She particularly loves creating fun and absorbing materials to help students achieve their exam potential.

Leander Oates

Reviewer: Leander Oates

Expertise: Physics Content Creator

Leander graduated with First-class honours in Science and Education from Sheffield Hallam University. She won the prestigious Lord Robert Winston Solomon Lipson Prize in recognition of her dedication to science and teaching excellence. After teaching and tutoring both science and maths students, Leander now brings this passion for helping young people reach their potential to her work at SME.