Graphical Representations of the Gas Laws (College Board AP® Chemistry): Study Guide

Graphical representations of the gas laws
The relationship between any two of the variables which describe the properties of an ideal gas can be established by keeping the other variables constant
These variables are:
Pressure
Volume
Temperature
Amount of gas (moles)
These relationships expressed mathematically and graphically are known as Gas Laws
Pressure-volume relationship: Boyle’s law
This relationship was first investigated by the British chemist, Robert Boyle, using a J-tube, showing that the volume of gas decreased as the pressure increased
Boyle’s law states that: the volume of a fixed amount of gas at constant temperature is inversely proportional to the pressure:
V ∝ 1/P ; PV = constant
Simplifying the mathematical equation gives Boyle’s equation:
P1V1 = P2V2
Pressure-volume relationship
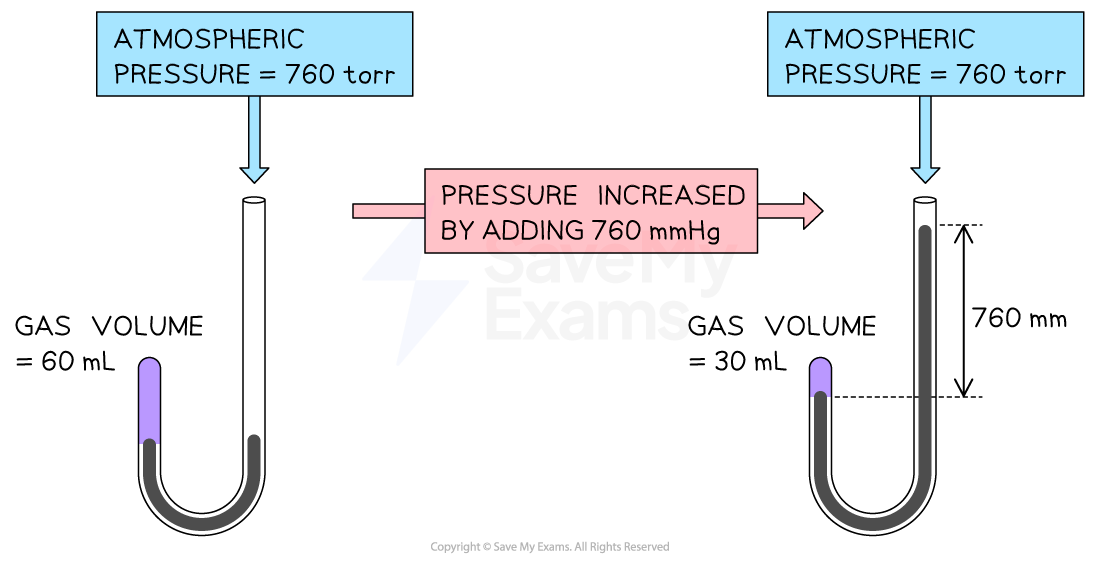
Boyle’s experiment uses a J-tube to demonstrate the volume-pressure relationship of a gas. Gas volume decreases on increasing the pressure in the tube
This relationship can also be shown with three graphs:
P against V is a curve for a fixed amount of gas at a fixed temperature
P against 1/V is a straight line through the origin, and PV against P is a horizontal line
Graphical representation of pressure-volume relationship
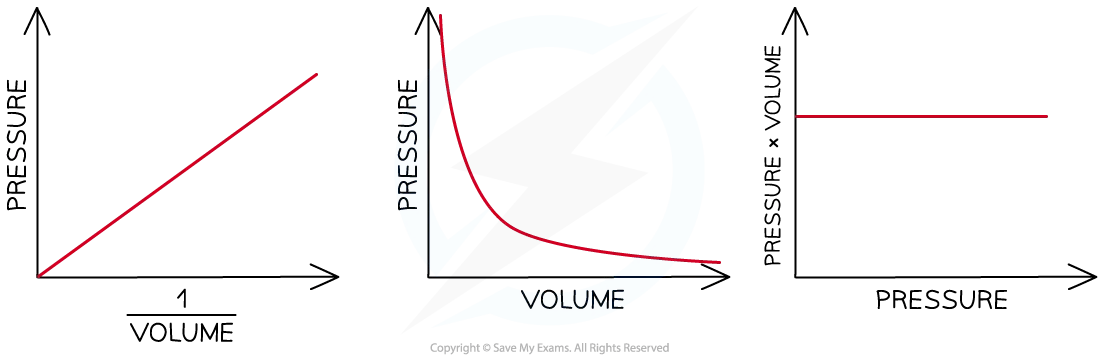
Graphical representations of Boyle’s Law
Worked Example
In a reaction involving the decomposition of limestone, CaCO3, 20.0 L of CO2 at 23 ℃ and 1.00 atm were collected.
What would be the volume of CO2 collected if the pressure were halved at the same temperature?
Answer:
Analyze: The question gives:
P1 = 1.00 atm
V1 = 20.0 L
P2 = ½ P1 = 0.500 atm
T = 23 ℃
The question asks for the final volume at constant temperature
Plan: Since temperature is kept constant, the volume-pressure relationship using Boyle’s equation would be required to determine the new volume
Solution: Rearrange the Boyle’s equation in terms of V2 and solve for V2:
V2 = P1 × V1 / P2
V2 = 1.00 × 20.0/ 0.5
V2 = 40.0 L
Temperature-volume relationship: Charles’s law
The earliest investigator of the effect of temperature on volume was French scientist, Jacques Charles
He observed that at constant pressure, the volume of a gas sample expands when heated and contracts when cooled
At any given pressure, the plot of volume versus temperature yields a straight line
By extrapolating the line to zero volume, the line meets the temperature axis at −273.15 ℃
Temperature-volume relationship on Celsius scale
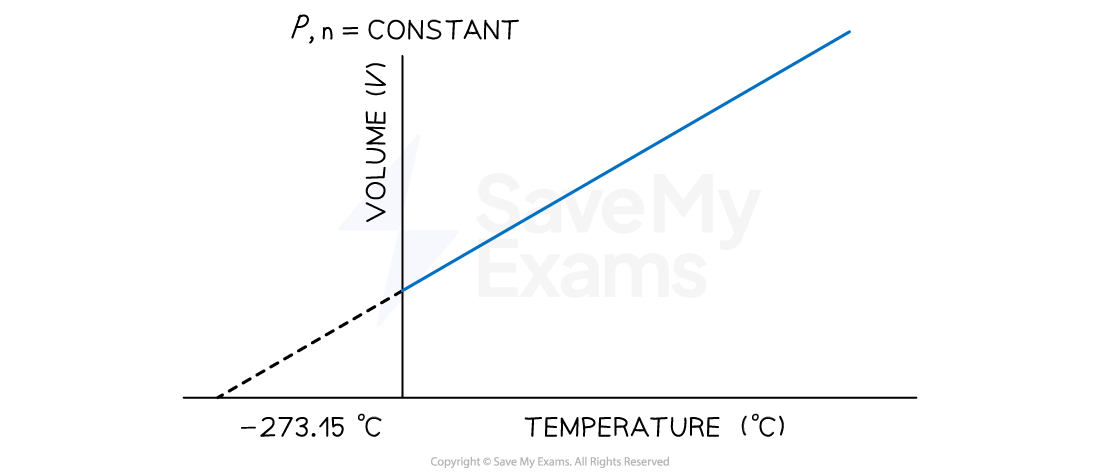
A graph showing the linear relationship between temperature (in degrees Celsius) and volume. The line intercepts the temperature axis at a value of −273.15 ℃
This implies that at a temperature of −273.15 ℃, the volume of a substance, if it remains gaseous will be zero
However, this could not happen, given that gases liquefy before this temperature, and the relationship does not apply to liquids
Kelvin temperature scale
In 1848, British physicist William Thomson, whose title was Lord Kelvin, realized the significance of the volume-temperature relationship using the Celsius temperature scale
He identified the lowest possible temperature as absolute zero
He then set up an absolute temperature scale, now called the Kelvin temperature scale (K) with absolute zero as the starting point
On the absolute temperature scale, 0 K is equivalent to −273.15 ℃
In terms of the Kelvin scale, the temperature-volume relationship known as Charles’s Law can be stated as: the volume of a fixed amount of gas maintained at constant pressure is directly proportional to its absolute temperature:
V ∝ T or V/T = constant
Simplifying the relationship gives:
V1/T1 = V2/T2
A plot of volume against temperature in Kelvin also gives a straight line which intercepts the volume and temperature axis at zero
Temperature-volume relationship on the Kelvin scale
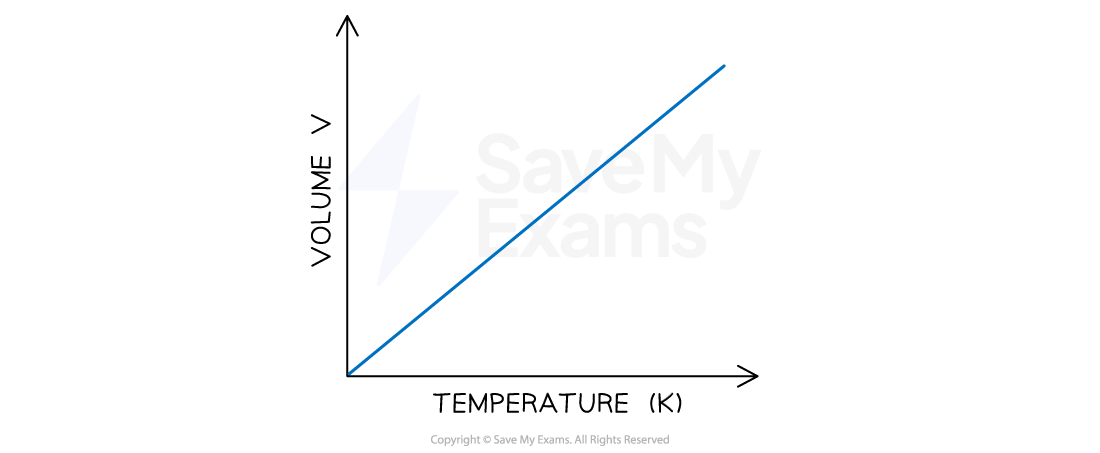
A graph showing the linear relationship between absolute temperature and volume. The line intercepts the temperature axis at a value of 0 K
Worked Example
A chemical reaction produced 4.38 mL of hydrogen gas at 19 ℃ and 1.97 atm pressure.
What volume of the gas would be produced at 25℃ at the same pressure?
Answer:
Analyze: From the question, the following parameters were provided
V1 = 4.38 mL
T1 = 19 ℃
T2 = 25 ℃
P = 1.97 atm (constant)
The question asks for the final volume at constant pressure
Plan: Since the pressure remains constant, the problem requires the use of the volume-temperature relationship expressed by Charles’s equation
Solution:
Step 1: Convert temperature values in ℃ to K:
T1 = 19 + 273.15 = 292.15 K
T2 = 25 + 273.15 = 298.15 K
Step 2: Rearrange Charles’s equation in terms of the final volume V2 and solve for V2:
V2 = V1 × T2 / T1
V2 = 4.38 × 298.15 / 292.15
V2 = 4.47 mL
Pressure-temperature relationship
At constant volume and amount of gas, pressure is directly proportional to absolute temperature: P ∝ T, so P1/T1 = P2/T2
A graph of P against T (in K) is a straight line through the origin
Pressure-temperature relationship on the Kelvin scale
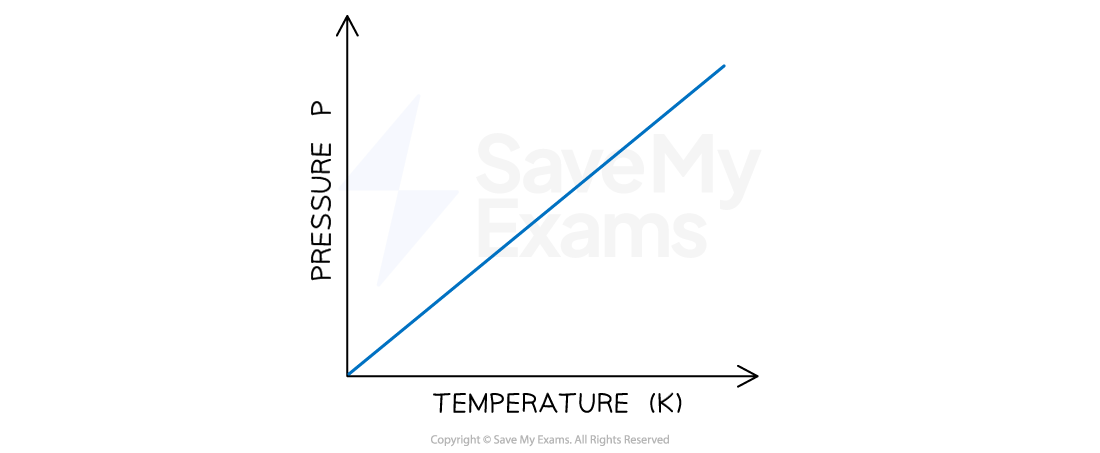
At constant volume and amount of gas, pressure is directly proportional to absolute temperature, so the line passes through the origin
Examiner Tips and Tricks
Divide, don't multiply: P1/T1 = P2/T2, not P1T1 = P2T2, and T must be in kelvins
Worked Example
A sealed, rigid container holds a sample of gas at 1.20 atm and 300 K. The container is heated to 450 K.
Calculate the new pressure of the gas.
Describe the graph of pressure against temperature (in K) for this sample.
Answer:
Answer 1:
The volume and amount of gas are constant, so P ∝ T and P1/T1 = P2/T2
P2 = P1 × T2 / T1
P2 = 1.20 × 450 / 300
P2 = 1.80 atm
Answer 2:
The graph is a straight line through the origin
Both points, (300 K, 1.20 atm) and (450 K, 1.80 atm), lie on it: increasing T by a factor of 1.5 increases P by a factor of 1.5
Quantity-volume relationship: Avogadro’s law
The relationship between the amount in moles of a gas and its volume follows from the work of Joseph Louis Gay-Lussac and Amedeo Avogadro
Gay-Lussac observed that at a given pressure and temperature, the volumes of gases that react with one another are in the ratios of small whole numbers
For example, two volumes of hydrogen gas react with one volume of oxygen gas to form two volumes of water vapor:
2H2 (g) + O2 (g) → 2H2O (g)
A few years later, Amedeo Avogadro interpreted Gay-Lussac’s observation by proposing an important hypothesis which set the foundation for demonstrating the mole-volume relationship and Avogadro’s Law
The hypothesis states that: Equal volumes of gases at the same temperature and pressure contain equal numbers of molecules
For example, at 0 ℃ and 1 atm (STP), 22.4 L of an ideal gas contains 6.022 × 10²³ molecules (Avogadro’s number), which is one mole
Avogadro’s law follows from this hypothesis: the volume of a gas maintained at constant temperature and pressure is directly proportional to the number of moles of the gas:
V ∝ n ; V/n = constant
Simplifying the relationship gives:
V1/n1 = V2/n2
Quantity-volume relationship
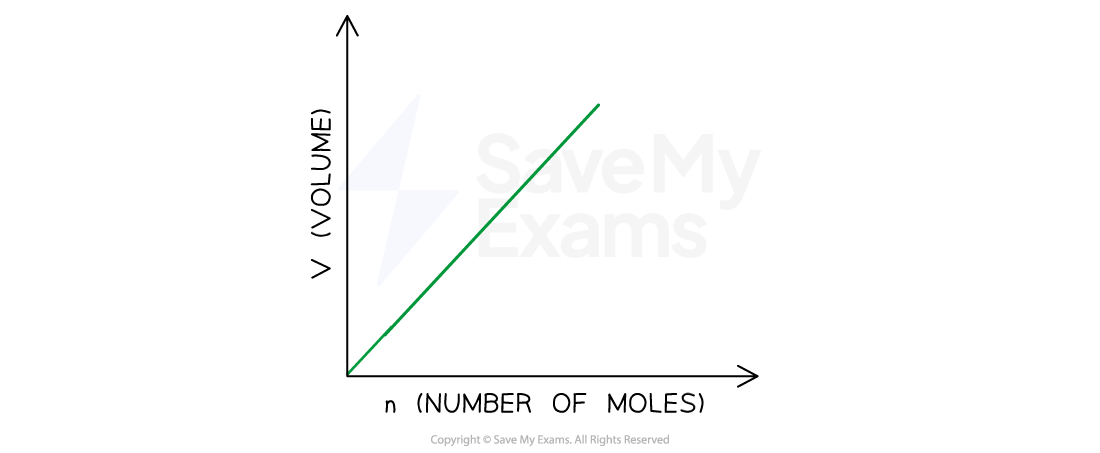
Graphical representation of Avogadro’s Law
Examiner Tips and Tricks
22.4 L mol−1 applies only to an ideal gas at STP (273.15 K and 1.0 atm). At any other temperature or pressure, find moles with PV = nRT
Never use 22.4 L mol−1 for a solution or a solid: moles of solute come from n = M × V

Unlock more, it's free!
Join the 100,000+ Students that ❤️ Save My Exams
the (exam) results speak for themselves:

Was this revision note helpful?
Build on this topic