Beer-Lambert Law (College Board AP® Chemistry): Study Guide

Beer-Lambert law
Principles of the Beer-Lambert law
Each light-absorbing species absorbs light most strongly at particular wavelengths
Chemists use the absorbing properties of chemical compounds for quantitative analysis, using solutions as samples
The amount of light absorbed by a sample is called absorbance
Absorbance (A) depends on three variables:
Molar absorptivity (ε), in M-1 cm-1: how strongly a molecule or ion absorbs light of a specific wavelength
Length in cm (b): The length of the path in which light travels through the sample
Both the path length and the concentration are proportional to the number of light-absorbing particles in the light path, so increasing either increases the absorbance
Concentration (c), in M: how much absorbing material is present in the sample
Absorbance has no units. It is directly proportional to molar absorptivity, path length and concentration, as the Beer–Lambert law shows:
Beer-Lambert law in experiments
In most experiments, the path length (b) and the wavelength of light are held constant, so absorbance (A) is proportional only to the concentration of the absorbing molecules or ions
This mathematical relation can be used to build a calibration curve
A calibration curve is a method used to calculate the concentration of an unknown sample, by comparing its absorbance with the absorbance of standards
Standards are solutions with known concentration
Building a calibration curve
Prepare a series of standard solutions.
Set the spectrophotometer to the wavelength of maximum absorbance (λmax, the optimum wavelength) for the species, which gives the most sensitive measurement, then measure the absorbance of each standard.
Plot an Absorbance vs Concentration curve.
Draw a straight line of best fit; for a solution that obeys the Beer–Lambert law it passes through, or very close to, the origin.
Example of a calibration curve
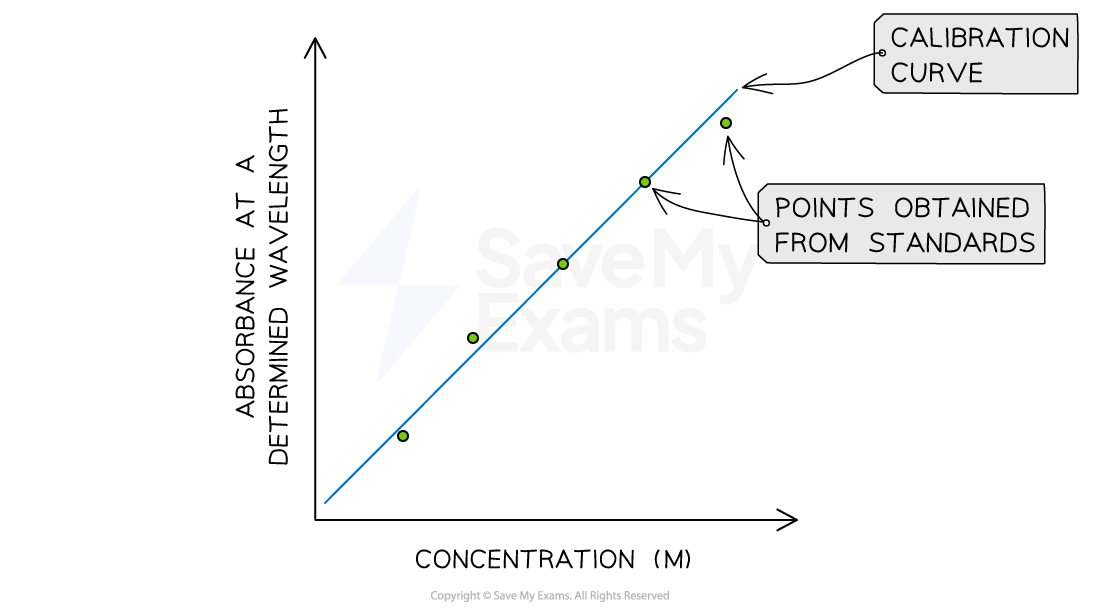
Graph showing a calibration curve Absorbance vs Concentration
Examiner Tips and Tricks
Calibration-curve questions give you the absorbance of an unknown: read its concentration from the line, or use the line’s equation — both routes can earn the point
Absorbance measures light absorbed by the colored species, so a lower absorbance means a lower concentration of that species in the light path — not a reaction with the light, the water or another reagent
Water left in the cuvette dilutes the sample, so the absorbance and the calculated concentration both come out lower
Worked Example
A student has prepared an experiment to determine the concentration of X (aq) in an unknown sample. The absorbance at different concentrations is shown below:

Calibration curve built using standard samples of X
If the absorbance of the unknown sample is 0.275 at 420 nm, what is the concentration of X in the unknown sample?
Answer:
Step 1: Read two standards either side of A = 0.275 from the graph
(0.004 M, 0.22) and (0.006 M, 0.33)
Step 2: Calculate the slope of the calibration line
slope =
slope = 55 M−1
The slope is equal to εb
Step 3: The line passes through the origin, as the Beer–Lambert law predicts, so:
A = 55c
Step 4: Rearrange and substitute the absorbance of the unknown sample
c =
c =
Step 5: Calculate the concentration of X
c = 5.00 × 10⁻³ M

Unlock more, it's free!
Join the 100,000+ Students that ❤️ Save My Exams
the (exam) results speak for themselves:

Was this revision note helpful?
Build on this topic