The Demand for Labour (Cambridge (CIE) A Level Economics): Revision Note
Exam code: 9708

Labour as a derived demand
The demand for labour is a derived demand - it arises from the demand for the goods and services that labour helps to produce, rather than being demanded for its own sake
If demand for a firm's output rises, more workers are needed
labour demand increases
If demand for a firm's output falls, fewer workers are needed
labour demand decreases
Labour demand therefore fluctuates directly with the demand for final goods and services
Factors that affect the demand for labour
1. The demand for the final product
As labour demand is derived, changes in demand for the final good or service are the most important determinant of labour demand
When an economy is booming and consumer demand is high, firms need more workers to meet output requirements - labour demand rises
During a recession, demand for goods and services falls and firms reduce their workforce - labour demand falls
This applies at both firm level (a firm losing a major contract needs fewer workers) and occupational level (a declining industry such as coal mining reduces demand for miners economy-wide)
For example, the global shift towards renewable energy has simultaneously reduced derived demand for coal miners in South Africa, Poland and India while increasing derived demand for solar panel engineers and wind turbine technicians
2. The price of the product being produced
A higher product price increases the revenue generated by each unit of output and therefore the value of each worker's contribution to the firm
This raises the marginal revenue product of labour (MRP_L) - covered in detail on the next page
this makes firms willing to employ more workers at any given wage rate
A fall in product price has the opposite effect
each worker generates less revenue, so firms demand less labour
For example, falling global coffee prices reduce the marginal revenue product of coffee pickers in Brazil and Ethiopia, reducing labour demand in those occupations even if wages are unchanged
3. The productivity of labour
If worker productivity rises (through training, improved technology or better management) each worker produces more output per hour
This raises the value of employing an additional worker, increasing labour demand
Conversely, if productivity falls, each worker contributes less to output and labour demand falls
For example, the introduction of automated machinery in Chinese and Vietnamese manufacturing has increased the productivity of remaining workers, raising demand for skilled machine operators while reducing demand for unskilled assembly workers
4. The ability to substitute capital for labour
Firms continually assess whether it is more cost-effective to use capital (machinery and technology) or labour to produce their output
If capital becomes relatively cheaper (through technological improvement or falling equipment costs), firms substitute capital for labour, reducing labour demand
If labour becomes relatively cheaper (for example following a reduction in social security contributions), firms substitute labour for capital, increasing labour demand
For example, the rapid adoption of automated checkout systems in retail across Singapore, Japan and many European economies has reduced derived demand for checkout operators, while increasing demand for technology maintenance workers
The demand curve for labour
The demand curve for labour shows the relationship between the wage rate and the quantity of labour demanded
It is downward sloping - as the wage rate falls, labour becomes cheaper relative to capital and relative to the marginal revenue it generates, so firms demand more labour
The market demand curve for labour is the horizontal sum of all individual firms' demand curves for labour in that market or occupation

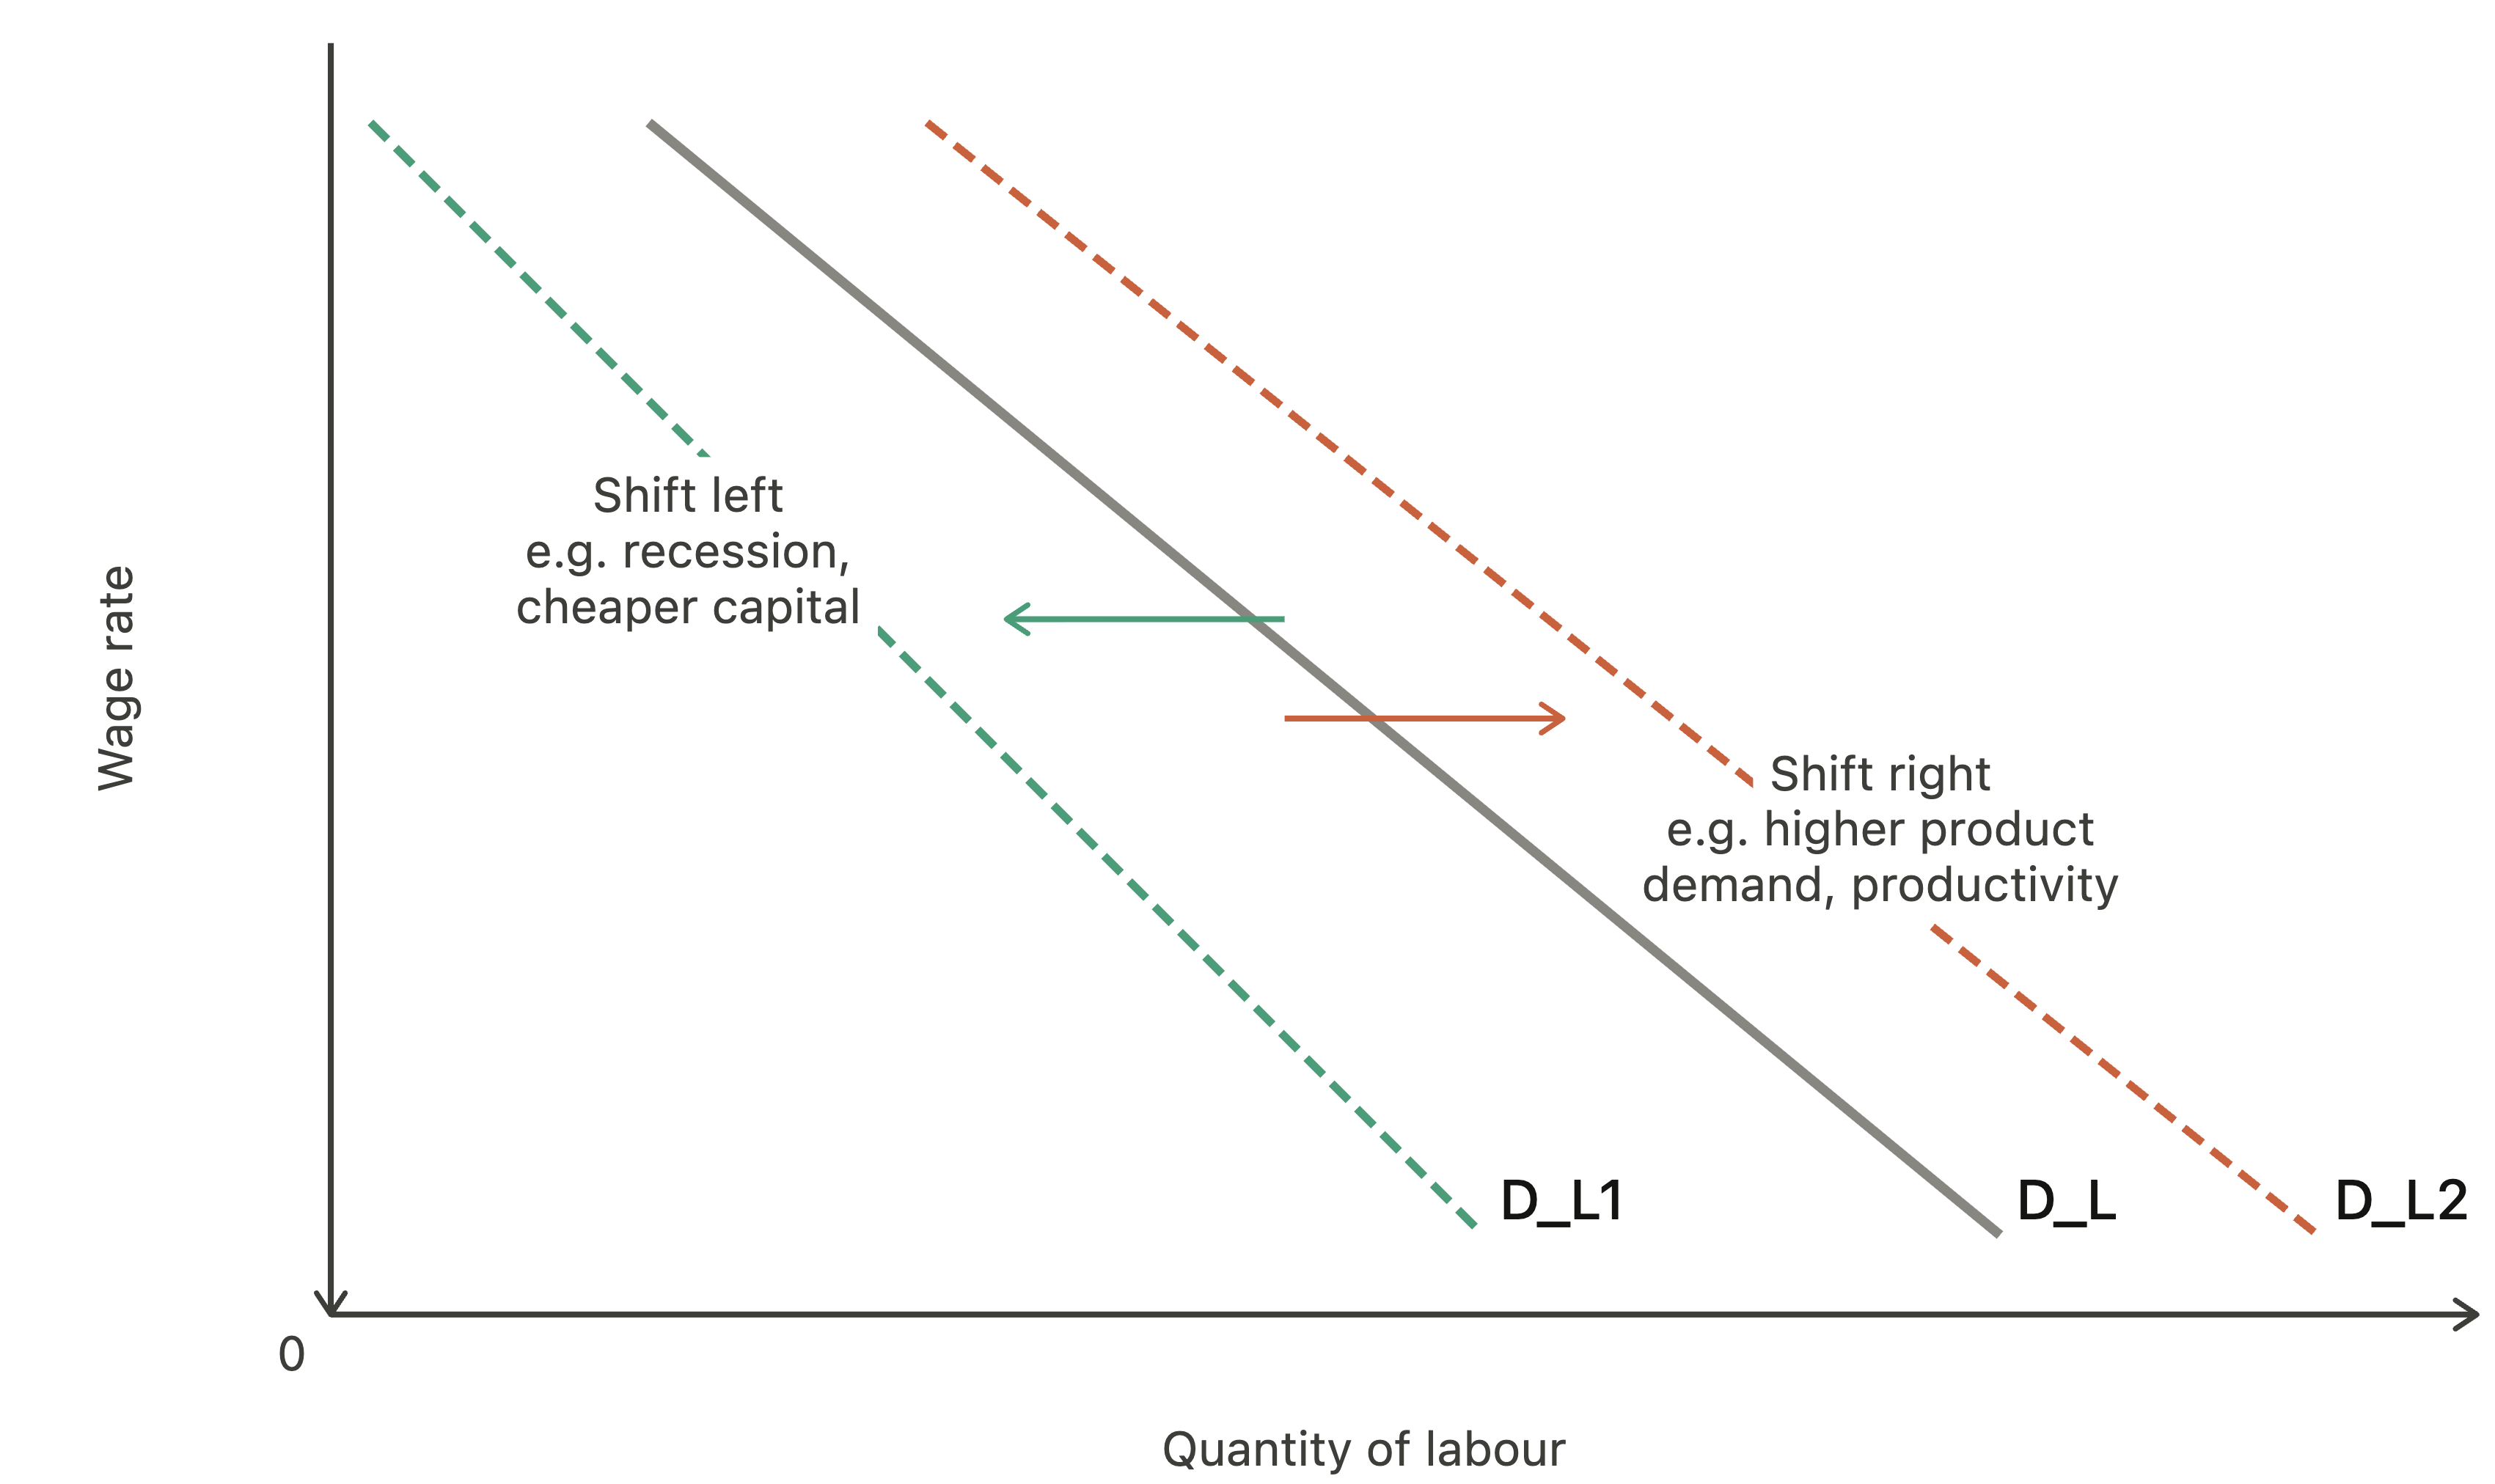
Diagram analysis
The demand curve D_L is downward sloping
a higher wage rate reduces the quantity of labour demanded
A change in the wage rate causes a movement along the demand curve
from one point to another on the same curve (W1 to W2)
A change in any other factor (product demand, productivity, price of capital) causes a shift of the demand curve
the entire curve moves left or right
Factors that shift the demand curve for labour
Caused by a change in any factor other than the wage rate
Rightward shift (D_L increases): higher product demand, higher product price, higher labour productivity, capital becoming more expensive relative to labour
Leftward shift (D_L decreases): lower product demand, lower product price, lower productivity, capital becoming cheaper relative to labour
Summary table
Factor | Effect on labour demand curve |
|---|---|
Wage rate rises |
|
Wage rate falls |
|
Demand for final product rises |
|
Demand for final product falls |
|
Product price rises |
|
Product price falls |
|
Labour productivity rises |
|
Labour productivity falls |
|
Capital becomes cheaper relative to labour |
|
Capital becomes more expensive relative to labour |
|
Examiner Tips and Tricks
Always frame labour demand as derived demand - connect changes in labour demand explicitly back to changes in demand for the final product.
Only a change in the wage rate causes a movement along the demand curve - everything else causes a shift. State this distinction explicitly before applying it.
Distinguish between firm-level demand (affected by that firm's product demand and pricing) and occupational demand (reflecting economy-wide trends - a recession shifts D_L left across an entire occupation).
Link to the margin and decision-making: firms demand labour up to the point where the marginal benefit of an additional worker equals its marginal cost.

Unlock more, it's free!
Join the 100,000+ Students that ❤️ Save My Exams
the (exam) results speak for themselves:

Was this revision note helpful?
