The Supply of Labour (Cambridge (CIE) A Level Economics): Revision Note

Exam code: 9708

Steve Vorster

Written by: Steve Vorster

Reviewed by: Lisa Eades

Updated on

The supply curve for labour

  • The supply curve for labour (S_L) shows the relationship between the wage rate and the quantity of workers willing to work in an occupation

  • It is upward sloping — as the wage rate rises, more workers are willing to supply their labour to that occupation

  • The market supply curve for labour is the horizontal sum of all individual workers' supply decisions in that market or occupation
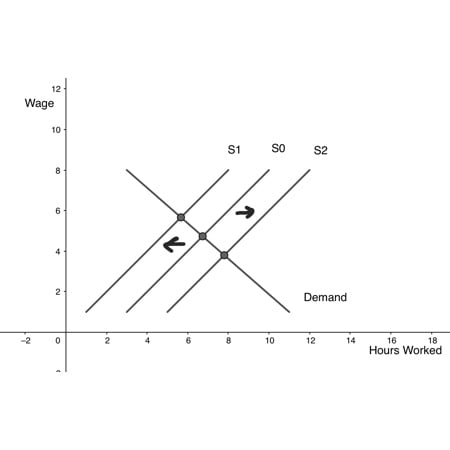
Graph showing labour supply curve \(S_L\), with wage rate (£) on the y-axis and quantity of labour on the x-axis. Points marked are \(W_1, W_2, Q_1, Q_2\).
There is a positive relationship between supply of labour and wage rate 

Diagram analysis 

  • The supply curve S_L is upward sloping - a higher wage rate increases the quantity of labour supplied

  • A change in the wage rate causes a movement along the supply curve

  • A change in any other factor causes a shift of the supply curve

Factors affecting the supply of labour

  • The occupational choices of workers are influenced by a range of wage and non-wage factors

Wage factors

  • Wage factors are the financial payments workers receive for their labour

Wage factor

Explanation

Wages and salary

  • An agreed hourly rate or fixed annual sum paid for labour

    • The primary financial incentive determining occupational choice

Performance-related pay

  • Payment linked to individual or firm performance

    • Motivates workers and attracts those confident in their productivity

Fringe benefits

  • Non-salary financial benefits, including childcare support, private healthcare, pension contributions and company vehicles

    • Can be significant in occupational choice, particularly in higher-income economies

Non-wage factors

  • Non-wage factors can be powerful motivators in determining which occupations workers choose to supply their labour to

Non-wage factor

Explanation

Example

Length of training required

  • Long training periods act as a barrier to entry, reducing the number of workers who supply labour to that occupation

  • It typically takes seven years to qualify as a doctor, restricting labour supply to medicine globally

Job security

  • Occupations with stable, long-term contracts attract more workers than those with short notice periods or high redundancy risk

  • Public sector employment in many economies offers greater security than private sector alternatives

Job satisfaction

  • Finding fulfilment in a role is a significant motivator — workers will accept lower wages for work they find meaningful

  • Teaching and nursing attract workers despite below-market wages in many countries

Career prospects

  • Occupations with clear promotion pathways and rising salaries attract more applicants

  • Management consultancy and investment banking attract graduates partly through defined career progression

Status and recognition

  • Some occupations carry higher social recognition, increasing labour supply despite other disadvantages

  • Medicine and law attract workers partly through social status in many cultures

Working conditions

  • Safe, comfortable or flexible working environments increase labour supply to an occupation

  • Technology firms in South Korea, India and the USA attract workers through flexible hours and campus facilities

Work/life balance

  • Workers increasingly value time outside work — occupations offering flexibility attract more applicants

  • The rise of remote and hybrid working post-2020 increased labour supply to roles offering location flexibility

Shifts vs movements in labour supply

Movement along the supply curve

  • Caused only by a change in the wage rate

  • If the wage rate rises, quantity of labour supplied increases — movement up and right along S_L

  • If the wage rate falls, quantity of labour supplied decreases — movement down and left along S_L

Shift of the supply curve

Graph showing wage versus hours worked, with three demand lines S1, S0, and S2 intersecting supply line at different points to indicate shifts.
The supply for labour can shift left or right
  • Caused by a change in any factor other than the wage rate

Factor

Effect on labour supply curve

Wage rate rises

  • Movement along — quantity supplied increases

Wage rate falls

  • Movement along — quantity supplied decreases

Training period lengthens

  • Shift left — fewer workers enter the occupation

Training period shortens

  • Shift right — more workers enter the occupation

Working conditions improve

  • Shift right

Working conditions worsen

  • Shift left

Income tax rises

  • Shift left — net return to work falls, reducing incentive to supply labour

Income tax falls

  • Shift right — net return to work rises

Welfare benefits rise

  • Shift left — opportunity cost of not working falls, reducing labour supply

Welfare benefits fall

  • Shift right — opportunity cost of not working rises

Net immigration increases

  • Shift right — larger pool of available workers

Net immigration decreases

  • Shift left — smaller pool of available workers

Trade union membership rises

  • Shift left — unions restrict labour supply to maintain wage levels

International examples of supply shifts

  • Immigration policy: in Singapore

    • Approximately 36% of the labour force are migrants — immigration policy has been a major determinant of labour supply across industries, particularly construction and healthcare

  • Welfare reform

    • Germany's Hartz IV reforms in the mid-2000s reduced welfare benefits and tightened eligibility, shifting the labour supply curve right as the opportunity cost of not working rose — contributing to a significant fall in unemployment

  • Training and education

    • South Korea's heavy investment in tertiary education increased the supply of highly skilled labour to technology and manufacturing occupations, contributing to the country's rapid industrial development

  • Remote working

    • The post-2020 shift to hybrid working increased labour supply to previously geographically constrained occupations in many countries, as workers were no longer required to live near their workplace

Examiner Tips and Tricks

Structure answers around wage factors (financial payments) vs non-wage factors (everything else) - examiners reward this distinction explicitly

Trade unions typically restrict labour supply to maintain wages above the competitive level - not increase it

Only a wage rate change causes a movement along S_L - everything else shifts the curve

Connect to the margin and decision-making: workers supply labour until the marginal benefit (wage) equals the marginal cost (leisure forgone)

Unlock more, it's free!

Join the 100,000+ Students that ❤️ Save My Exams

the (exam) results speak for themselves:

Steve Vorster

Author: Steve Vorster

Expertise: Economics & Business Subject Lead

Steve has taught A Level, GCSE, IGCSE Business and Economics - as well as IBDP Economics and Business Management. He is an IBDP Examiner and IGCSE textbook author. His students regularly achieve 90-100% in their final exams. Steve has been the Assistant Head of Sixth Form for a school in Devon, and Head of Economics at the world's largest International school in Singapore. He loves to create resources which speed up student learning and are easily accessible by all.

Lisa Eades

Reviewer: Lisa Eades

Expertise: Business Content Creator

Lisa has taught A Level, GCSE, BTEC and IBDP Business for over 20 years and is a senior Examiner for Edexcel. Lisa has been a successful Head of Department in Kent and has offered private Business tuition to students across the UK. Lisa loves to create imaginative and accessible resources which engage learners and build their passion for the subject.