Superposition & Stationary Waves (OCR A Level Physics): Exam Questions

Exam code: H556

58 mins15 questions
1a
2 marks

This question is about investigations involving an electromagnetic wave.

A vertical transmitter aerial emits a vertically polarised electromagnetic wave which travels towards a vertical receiver aerial. The wavelength of the wave is 0.60 m.

Fig. 5.1 shows a short section of the oscillating electric field of the electromagnetic wave.

q5-paper-3-nov-2020-ocr-a-level-physics

Fig. 5.1

Calculate the frequency f of the transmitted wave.

f = ...................................... Hz

1b
3 marks

The electromagnetic wave is caused by electrons oscillating in the transmitter aerial. Each electron oscillates with simple harmonic motion.

Calculate the maximum acceleration amax of an electron which oscillates with an amplitude of 4.0 × 10⁻⁶ m.

amax = ................................... m s–2

1c
1 mark

Suggest why the diode in Fig. 5.1 is necessary for an ammeter to detect a signal at the receiver aerial.

1d
6 marks

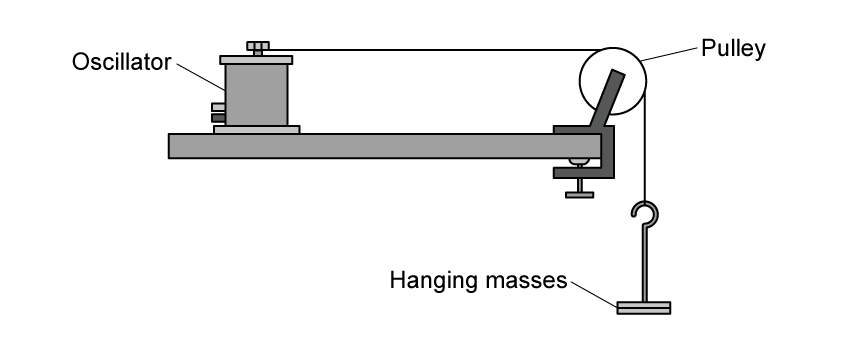
A student carries out two investigations with these electromagnetic waves.

In investigation 1, the student rotates the receiver aerial about the horizontal axis joining the two aerials, as shown in Fig. 5.1.

In investigation 2, the student places a metal sheet behind the receiver aerial. The student moves the sheet backwards and forwards along the horizontal axis joining the two aerials, as shown in Fig. 5.2.

q5d-paper-3-nov-2020-ocr-a-level-physics

Fig. 5.2

For each of these two investigations:

  • Explain why the ammeter sometimes gives a maximum reading and sometimes a zero (or near zero) reading.

  • State the orientations of the receiver aerial in investigation 1, and the positions of the metal sheet in investigation 2, where these maximum and zero readings would occur.

2a
6 marks

Hydrogen atoms excited in a discharge tube only emit four different discrete wavelengths of visible photons.

In a semi-darkened room, a single slit is placed in front of the discharge tube. A student holds a diffraction grating which has 300 lines per millimetre.

The student looks through the grating at a 15cm plastic ruler placed 0.50m away, as shown in Fig. 5.1.

The paths of the different colours of light from the slit to the student’s eye are shown in Fig. 5.2.

q5a-paper-3-june-2019-ocr-a-level-physics

Fig. 5.1 (not to scale)                                           Fig. 5.2 (not to scale)

Four first order images of the slit, one at each photon wavelength, are observed as vertical lines against the background of the plastic ruler, as shown in Fig. 5.3.

q5a-2-paper-3-june-2019-ocr-a-level-physics

Fig. 5.3

The student decides to determine the wavelength of the photons which form the red line observed at x = 10 cm on the ruler.

  • Describe how the information that has been given can be used to determine the wavelength of the red photons.

  • Estimate the percentage uncertainty in the measured value of the wavelength.

2b
3 marks

i) Show that the energy of a photon of wavelength 486 nm is 4.09 × 10⁻¹⁹ J.

[1]

ii) Fig. 5.4 shows some of the energy levels of an electron in a hydrogen atom.

q5b-paper-3-june-2019-ocr-a-level-physics

Fig. 5.4 (not to scale)

Draw an arrow on Fig. 5.4 to show an electron transition which would cause the emission of a photon of wavelength 486 nm.

[2]

3a
2 marks

Fig. 17.1 shows the variation with distance of the displacement of a stationary wave at time t = 0.

q17a-paper-2-june-2019-ocr-a-level-physics

Fig. 17.1

The period of the wave is T.

i) On Fig. 17.1, sketch a graph to show the variation of the displacement at time t =T over 2.

[1]

ii) On Fig. 17.1, show the positions of all the nodes. Label each node N.

[1]

3b
3 marks

Stationary sound waves are formed in a tube closed at one end.

Fig. 17.2 shows three stationary wave patterns formed in the air column of the tube.

q17b-paper-2-june-2019-ocr-a-level-physics

Fig. 17.2

The frequency f of the oscillations for each stationary wave is shown in Fig. 17.2.

Use Fig. 17.2 to explain how the frequency f of the sound wave depends on the wavelength lambda.

4a
1 mark

State the principle of superposition of waves.

4b
5 marks

Fig. 16.1 shows an arrangement to demonstrate the interference of monochromatic light.

q16b-paper-2-june-2017-ocr-a-level-physics

Fig. 16.1

Coherent blue light from a laser is incident at a double-slit. The separation between the slits is 0.25 mm. A series of dark and bright lines (fringes) appear on the screen. The screen is 4.25 m from the slits.

Fig. 16.2 shows the dark and bright fringes observed on the screen.

q16c-paper-2-june-2017-ocr-a-level-physics

Fig. 16.2

The pattern shown in Fig. 16.2 is drawn to scale.

i) Use Fig. 16.2 to determine accurately the wavelength of the blue light from the laser.

wavelength = ............................ m [3]

ii) The blue light is now replaced by a similar beam of red light.

State and explain the effect, if any, on the fringes observed on the screen.

[2]

5a
2 marks

Fig. 19.1 shows the image from an experiment using a ripple tank.

q19a-paper-2-june-2018-ocr-a-level-physics

Fig. 19.1

A straight ruler repeatedly hits the surface of water. Waves on the surface of the water travel in the direction shown by the two large upward white arrows. The waves are incident at a solid barrier.

Closely examine the image shown in Fig. 19.1.

State two wave phenomena (properties) that can be observed in this image. You may annotate Fig. 19.1 to support your answer.

5b
3 marks

Two transmitters, A and B, emit coherent microwaves in all directions. A receiver is moved at constant speed along the line from P to Q which is parallel to the line joining the two transmitters, as shown in Fig. 19.2.

q19b-paper-2-june-2018-ocr-a-level-physics

Fig. 19.2

Explain why the output signal from the receiver fluctuates between minimum and maximum values as the receiver moves from P to Q.

6a
2 marks

A student investigates stationary waves on a string. Fig. 16.1 shows the string held under tension between an oscillator and a pulley.

Fig. 16.1

An oscillator connected to a pulley system by a string. The string runs over the pulley and is kept taut by hanging masses.

The frequency of the oscillator is varied until different stationary wave patterns form on the string.

Explain how a stationary wave pattern is produced in this experiment.

6b
4 marks

The frequency of the oscillator is adjusted until the third harmonic is observed on the string.

(i) On Fig. 16.2, sketch the stationary wave pattern for the third harmonic. Label the nodes with the letter N and the antinodes with the letter A.

Fig. 16.2

Dashed horizontal line representing the string at rest with solid black circles at each end representing the fixed points.

[2]

(ii) Describe how the wavelength of the transverse wave on this string can be determined.

[1]

6c
Sme Calculator
3 marks

The student varies the frequency f of the vibration of the string until different stationary wave patterns are formed. The length of the string and the tension in the string are kept constant. For each mode of vibration, the mean distance d between adjacent nodes is measured.

The results are recorded in the table below.

f / Hz

d / m

1 over d / m-1

30

1.20

60

0.60

90

0.42

120

0.32

3.2

150

0.25

4.0

180

0.20

5.0

(i) Complete the last column of the results table for the 30 Hz, 60 Hz, and 90 Hz vibration frequencies.

[1]

(ii) Plot the results from the table on the graph. Three points have already been plotted.

A graph with x-axis labelled frequency (f) in Hz from 0 to 180 in increments of 30, and y-axis labelled inverse distance (1/d) in m⁻¹ from 0 to 6.0 in increments of 0.5. Three data points are plotted at frequencies 120, 150 and 180.

[1]

(iii) Draw a suitable line of best fit through the data points

[1]

6d
Sme Calculator
3 marks

Use your graph to determine the speed v of the wave on the string.