Adaptation to Environment (DP IB Biology: SL): Exam Questions

47 mins12 questions
1a
5 marks

Identify the biotic and abiotic factors by placing a (✓) or (X) in the correct columns in the table below:


Biotic

Abiotic

Sunlight


Predation


Food availability


Mineral availability


Temperature


1b
2 marks

Marram grass (Ammophila breviligulata, pictured below) is an example of a grass species that is adapted to live on sand dunes.

marram grass on sand dunes

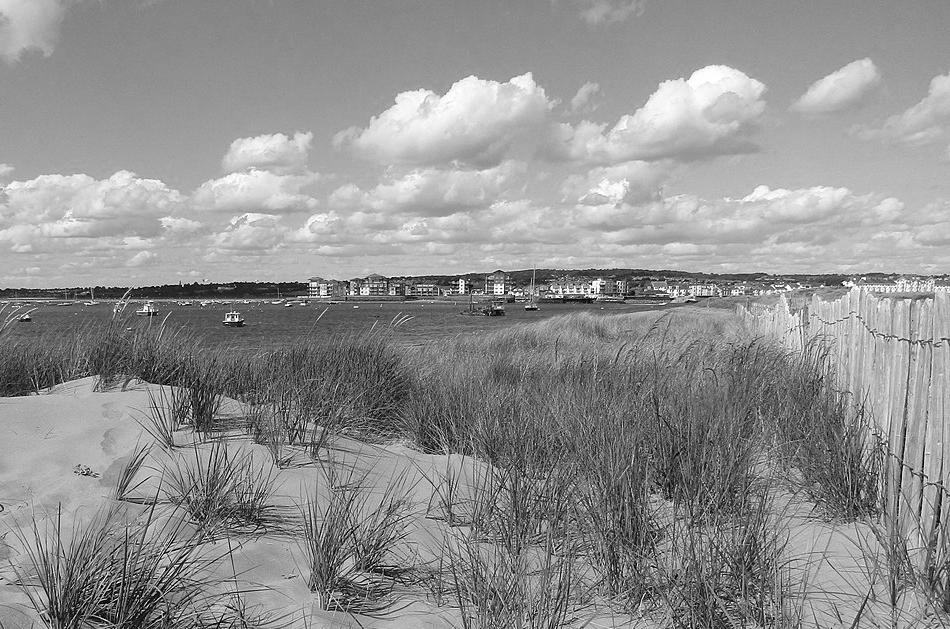
Partonez, CC BY-SA 4.0, via Wikimedia Commons (opens in a new tab)

State two adaptations that you would expect marram grass to have in order to aid survival in this habitat. 

1a
3 marks

The image below shows a mangrove forest, an example of a tropical, coastal habitat.

black-mangroves

Katja Schulz, CC BY 2.0, via Wikimedia Commons (opens in a new tab)

State three abiotic factors acting on mangrove trees in this habitat.

1b
3 marks

(i) Identify one adaptation of mangrove trees that is visible in the image.

[1]

(ii) Explain how this adaptation aids survival.

[2]

1c
3 marks

The map below shows the global distribution of mangrove habitat.

mangrove-distribution-map

(i) Describe mangrove forest distribution.

[1]

(ii) Suggest an explanation for the distribution shown in the map.

[2]

1d
3 marks

Explain how climate change may affect the distribution of mangrove habitat.

2a
4 marks

A group of scientists studied the effect of water depth on distribution of several groups of non-motile marine organisms. Some of their results are shown in the graph below.

marine-species-distribution-kite-diagram

Describe a method that could have been used to collect this data. 

2b
6 marks

The scientists concluded from the data that the species recorded in the graph were not directly interacting with each other.

(i) Evaluate this conclusion.

[3]

(ii) Suggest three other factors that could be influencing the distribution of the recorded species.

[3]

2c
2 marks

A student suggested that the researchers should have included fish species in the survey. 

(i) Explain why the scientists could not have used the method in (a) to assess fish distribution.

[1]

(ii) Suggest a possible alternative method for assessing fish distribution.

[1]

3a
2 marks

The graph below shows the impact of environmental factors on biome development.

Biomes chart showing relationship between mean annual temperature (°C) and precipitation (cm), including tundra, taiga, forest types, and desert.

Describe the conditions under which the following biome types will develop, according to the graph:

(i) Temperate rainforest

[1]

(ii) Tropical forest

[1]

3b
1 mark

The transition between one biome and another is usually gradual, and there are some situations where variables other than those indicated on the graph may influence biome development (indicated on the graph by dashed line).

Suggest a variable, other than those shown on the graph axes, that may influence biome development in these transition zones.

3c
5 marks

Plant species found in desert biomes often share similar features.

(i) Explain two features common to desert biome plants.

[2]

(ii) Explain why desert biome species share these features despite living in different parts of the world.

[3]