Syllabus Edition
First teaching 2025
First exams 2027
Answering SAQs - Paper 3: Question 2 (HL Only) (DP IB Psychology): Revision Note

Paper 3 - question 2
Question 2 in Paper 3 tests your ability to analyse the findings from one of the sources provided in the exam
This question is worth 6 marks
The command term 'analyse' requires you:
to break down the findings of a study/source into their essential elements
interpret the data, link it to the claim and form a conclusion
Example Question 2
Analyse the findings from source 2 and state a conclusion linked to the claim that the use of technology in education may negatively affect students' mental health [6 marks]
How to approach Question 2
Identify the key findings in the source (summarise clearly)
Analyse the findings by explaining what they suggest in relation to the claim
Link the findings to a relevant theory or concept
Conclude with a clear one-sentence statement directly addressing the claim
Examiner Tips and Tricks
“Analyse” means you should:
identify key patterns, trends or differences in the findings
explain what these findings suggest rather than just describing them
link the findings to the claim in the question (e.g. technology influences mental health)
Use comparative language where appropriate (e.g. higher than, lower than, more likely)
To access full marks, a conclusion is required. Your conclusion should:
directly address the claim in the question (technology determines…)
be qualified where appropriate (e.g. to some extent, partially)
be consistent with the evidence discussed
Avoid simply restating the data — focus on explaining what the findings mean in relation to the claim
Worked Example
Here is an example of a Paper 3 source and a 6-mark SAQ using technology (HL extension) in the Learning & Cognition context:
Source 2
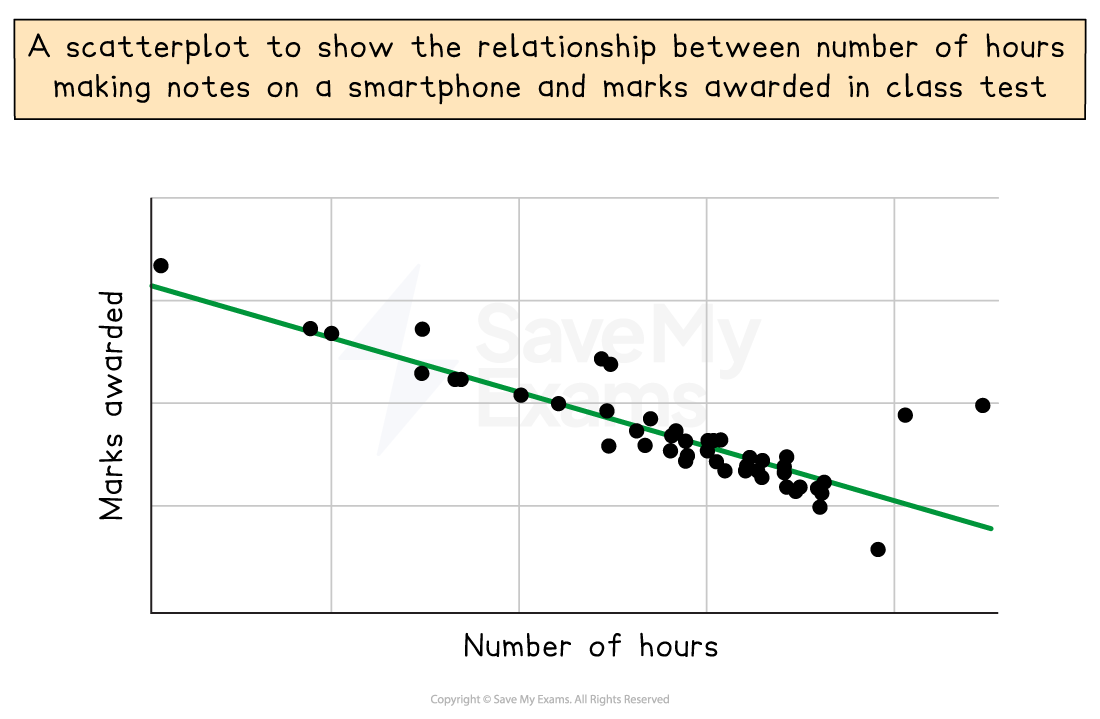
Q2: Analyse the findings from source 2 and state a conclusion based on these findings.
[6 marks]
Model answer
The data is in the form of a scatterplot in which the co-variables are the number of hours making notes on a smartphone and marks awarded in a class test. The graph shows that there is a reasonably strong negative relationship between the two variables. There are some outliers but not enough to significantly detract from the general negative trend of the data. The researcher may conclude that making class notes using a smartphone impedes learning, as evidenced by its relationship to marks gained in class tests.
As this research is a correlation, however, the researcher will not be able to confidently conclude that making notes on a smartphone impedes learning, as there is no way of establishing cause-effect between the two variables. Thus, it is unclear as to whether making notes on a smartphone impairs test performance.
Guidance
Your analysis should refer to the raw scores (if these are included) and/or the descriptive/inferential statistics presented in the findings
For descriptive stats this may comprise the mean/median/mode as measures of central tendency and the range/standard deviation as measures of dispersion
For inferential stats this may comprise a statement of significance and/or link to the level of probability used
You should always state which condition of the IV performed better
You should comment on what the stats seem to suggest about performance per condition
If relevant, you should comment on what the data tells you about the population, e.g., is this a normal distribution or is it skewed?
If the research is qualitative then you should focus on how the findings have been categorised/presented and whether there are drawbacks or limitations to how it has been gathered (e.g., sample size, potential bias)
You should draw a conclusion based on what the data in the source/study tells you about what is being investigated
E.g., do the findings suggest that X does affect Y?
Worked Example
Here is an example of a Paper 3 source and a 6-mark SAQ using motivation (HL extension) in the Health & Wellbeing context:
Source 2
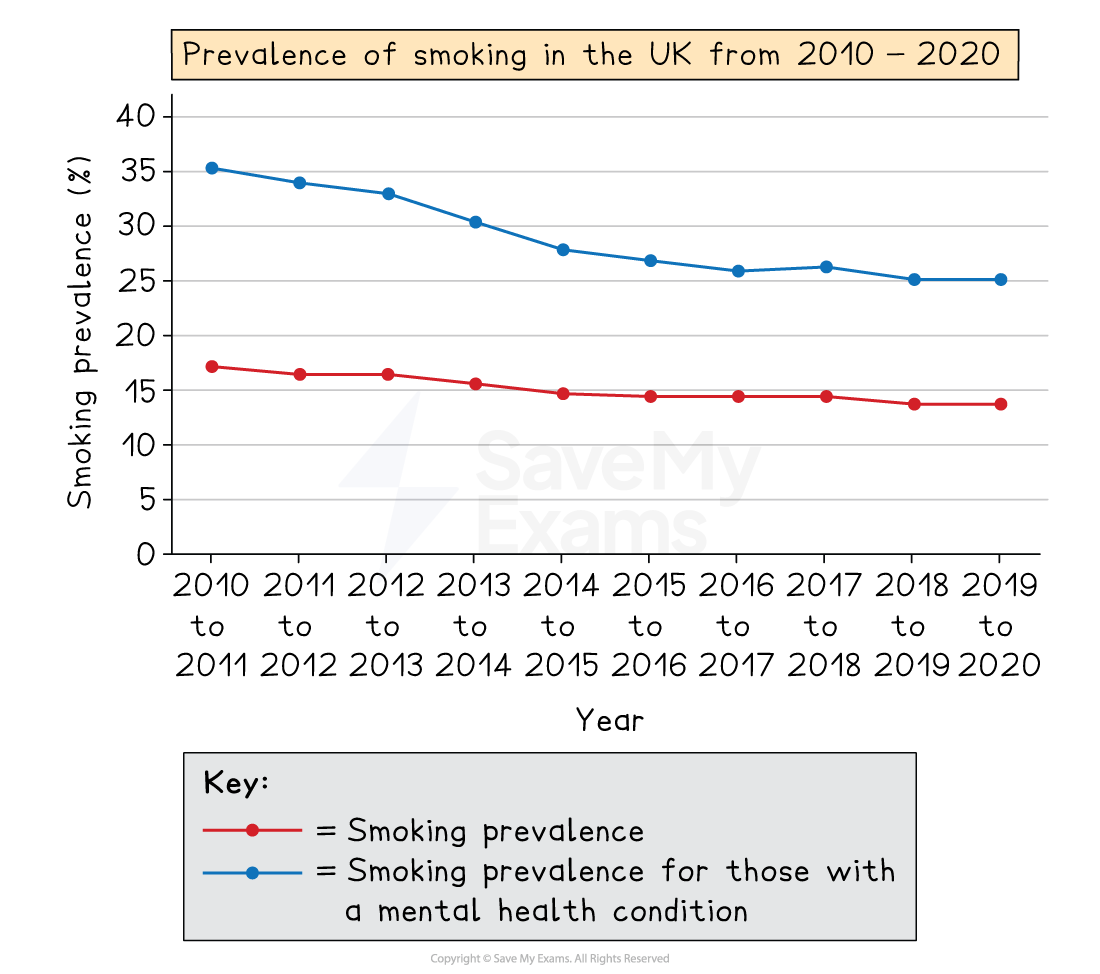
Q2: Analyse the findings from source 2 and state a conclusion linked to the claim that awareness of decreasing prevalence rates for smoking should act as motivation to quit smoking.
[6 marks]
Model answer:
The line graph shows that smoking prevalence decreased in both the general population and for the population of those with mental health conditions from 2010 to 2020. This suggests that smoking is becoming less popular over time, possibly due to increased awareness of its harmful effects or because of other factors (e.g., lack of places to smoke in public, peer influence).
These findings could act as motivation to quit smoking, as they could provide encouragement for the smoker, i.e., other people have managed to quit. Alternatively, the smoker may feel that by smoking they are not conforming to a general social norm which is not to smoke. This could work as motivation to quit smoking, as by not smoking they are adhering to the majority group norm.
Guidance:
Your analysis should refer to the raw scores (if these are included) and/or the descriptive/inferential statistics presented in the findings
For descriptive stats this may comprise the mean/median/mode as measures of central tendency and the range/standard deviation as measures of dispersion
For inferential stats this may comprise a statement of significance and/or link to the level of probability used
You should always state which condition of the IV performed better
You should comment on what the stats seem to suggest about performance per condition
If relevant, you should comment on what the data tells you about the population, e.g., is this a normal distribution or is it skewed?
If the research is qualitative then you should focus on how the findings have been categorised/presented and whether there are drawbacks or limitations to how it has been gathered (e.g., sample size, potential bias)
You should draw a conclusion based on what the data in the source/study tells you about what is being investigated
E.g., do the findings suggest that X does affect Y?

Unlock more, it's free!
Join the 100,000+ Students that ❤️ Save My Exams
the (exam) results speak for themselves:

Was this revision note helpful?
