Syllabus Edition
First teaching 2025
First exams 2027
Social Media & Group Behaviour (DP IB Psychology): Revision Note

Social media & group behaviour
Worked Example
Here is an example of a Paper 3 source and a 3-mark SAQ using technology (HL extension) in the Human Relationships context:
Source 1:
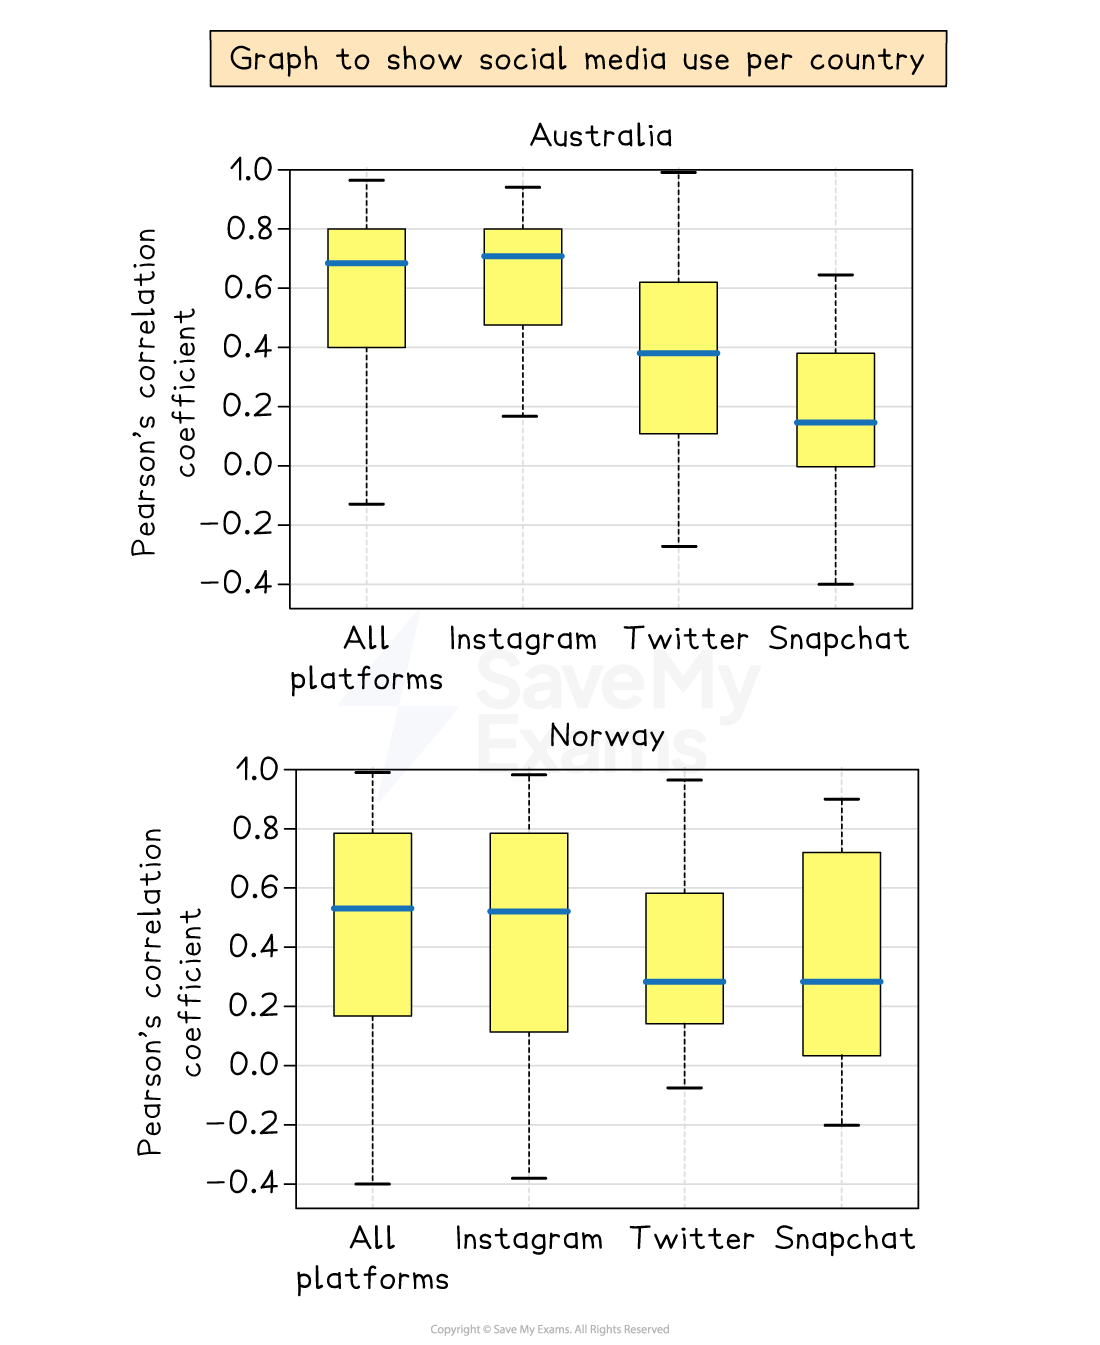
Q1. Explain one limitation linked to the interpretation of the data in this source.
[3 marks]
Model answer:
These two box-and-whisker plots reveal that (using Pearson's correlational coefficient) Instagram performs best re: monthly traffic in both countries compared to Twitter and Snapchat. One issue that limits the analysis of this data is that correlations can show a relationship but not cause-effect so Instagram as a platform will not know why it has outperformed the other two, only that it has.
or
The 'whiskers' of each boxplot indicate the range of the data, which is limited, as it they only account for the highest and lowest values per data set; they do not indicate the variety or distribution of scores between these two points.
or
The performance of Instagram is slightly better and more robust in Australia than in Norway, as it shows a 70% median correlation. Median scores do not use all the values in a data set which makes them less representative of the true central tendency than the mean.
Guidance
Use only the information provided by the graph/chart: do not 'invent' data or make assumptions as to what may be behind the data, e.g., what the VRET consisted of or your own opinions on VRET generally
Do not write too much – there are only 3 marks available for this question and you need time to complete the higher-value questions on this paper
The question is asking for one limitation so don't provide two or more, as you will not be rewarded for this
The question is asking for what limits interpretation of the data so don't waste time/marks by stating any advantages/strengths

Unlock more, it's free!
Join the 100,000+ Students that ❤️ Save My Exams
the (exam) results speak for themselves:

Was this revision note helpful?
