1
4 marks
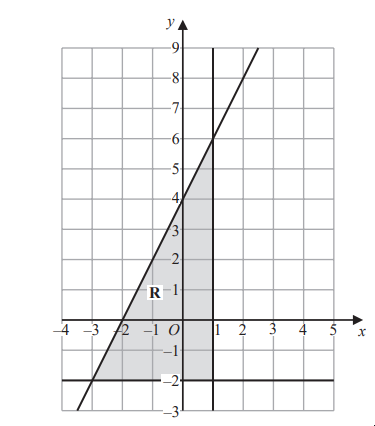
The region R, shown shaded in the diagram, is bounded by three straight lines.
Find the inequalities that define R
Was this exam question helpful?
Exam code: 4MA1
The region R, shown shaded in the diagram, is bounded by three straight lines.
Find the inequalities that define R
Was this exam question helpful?
The region R, shown shaded in the diagram, is bounded by three straight lines.
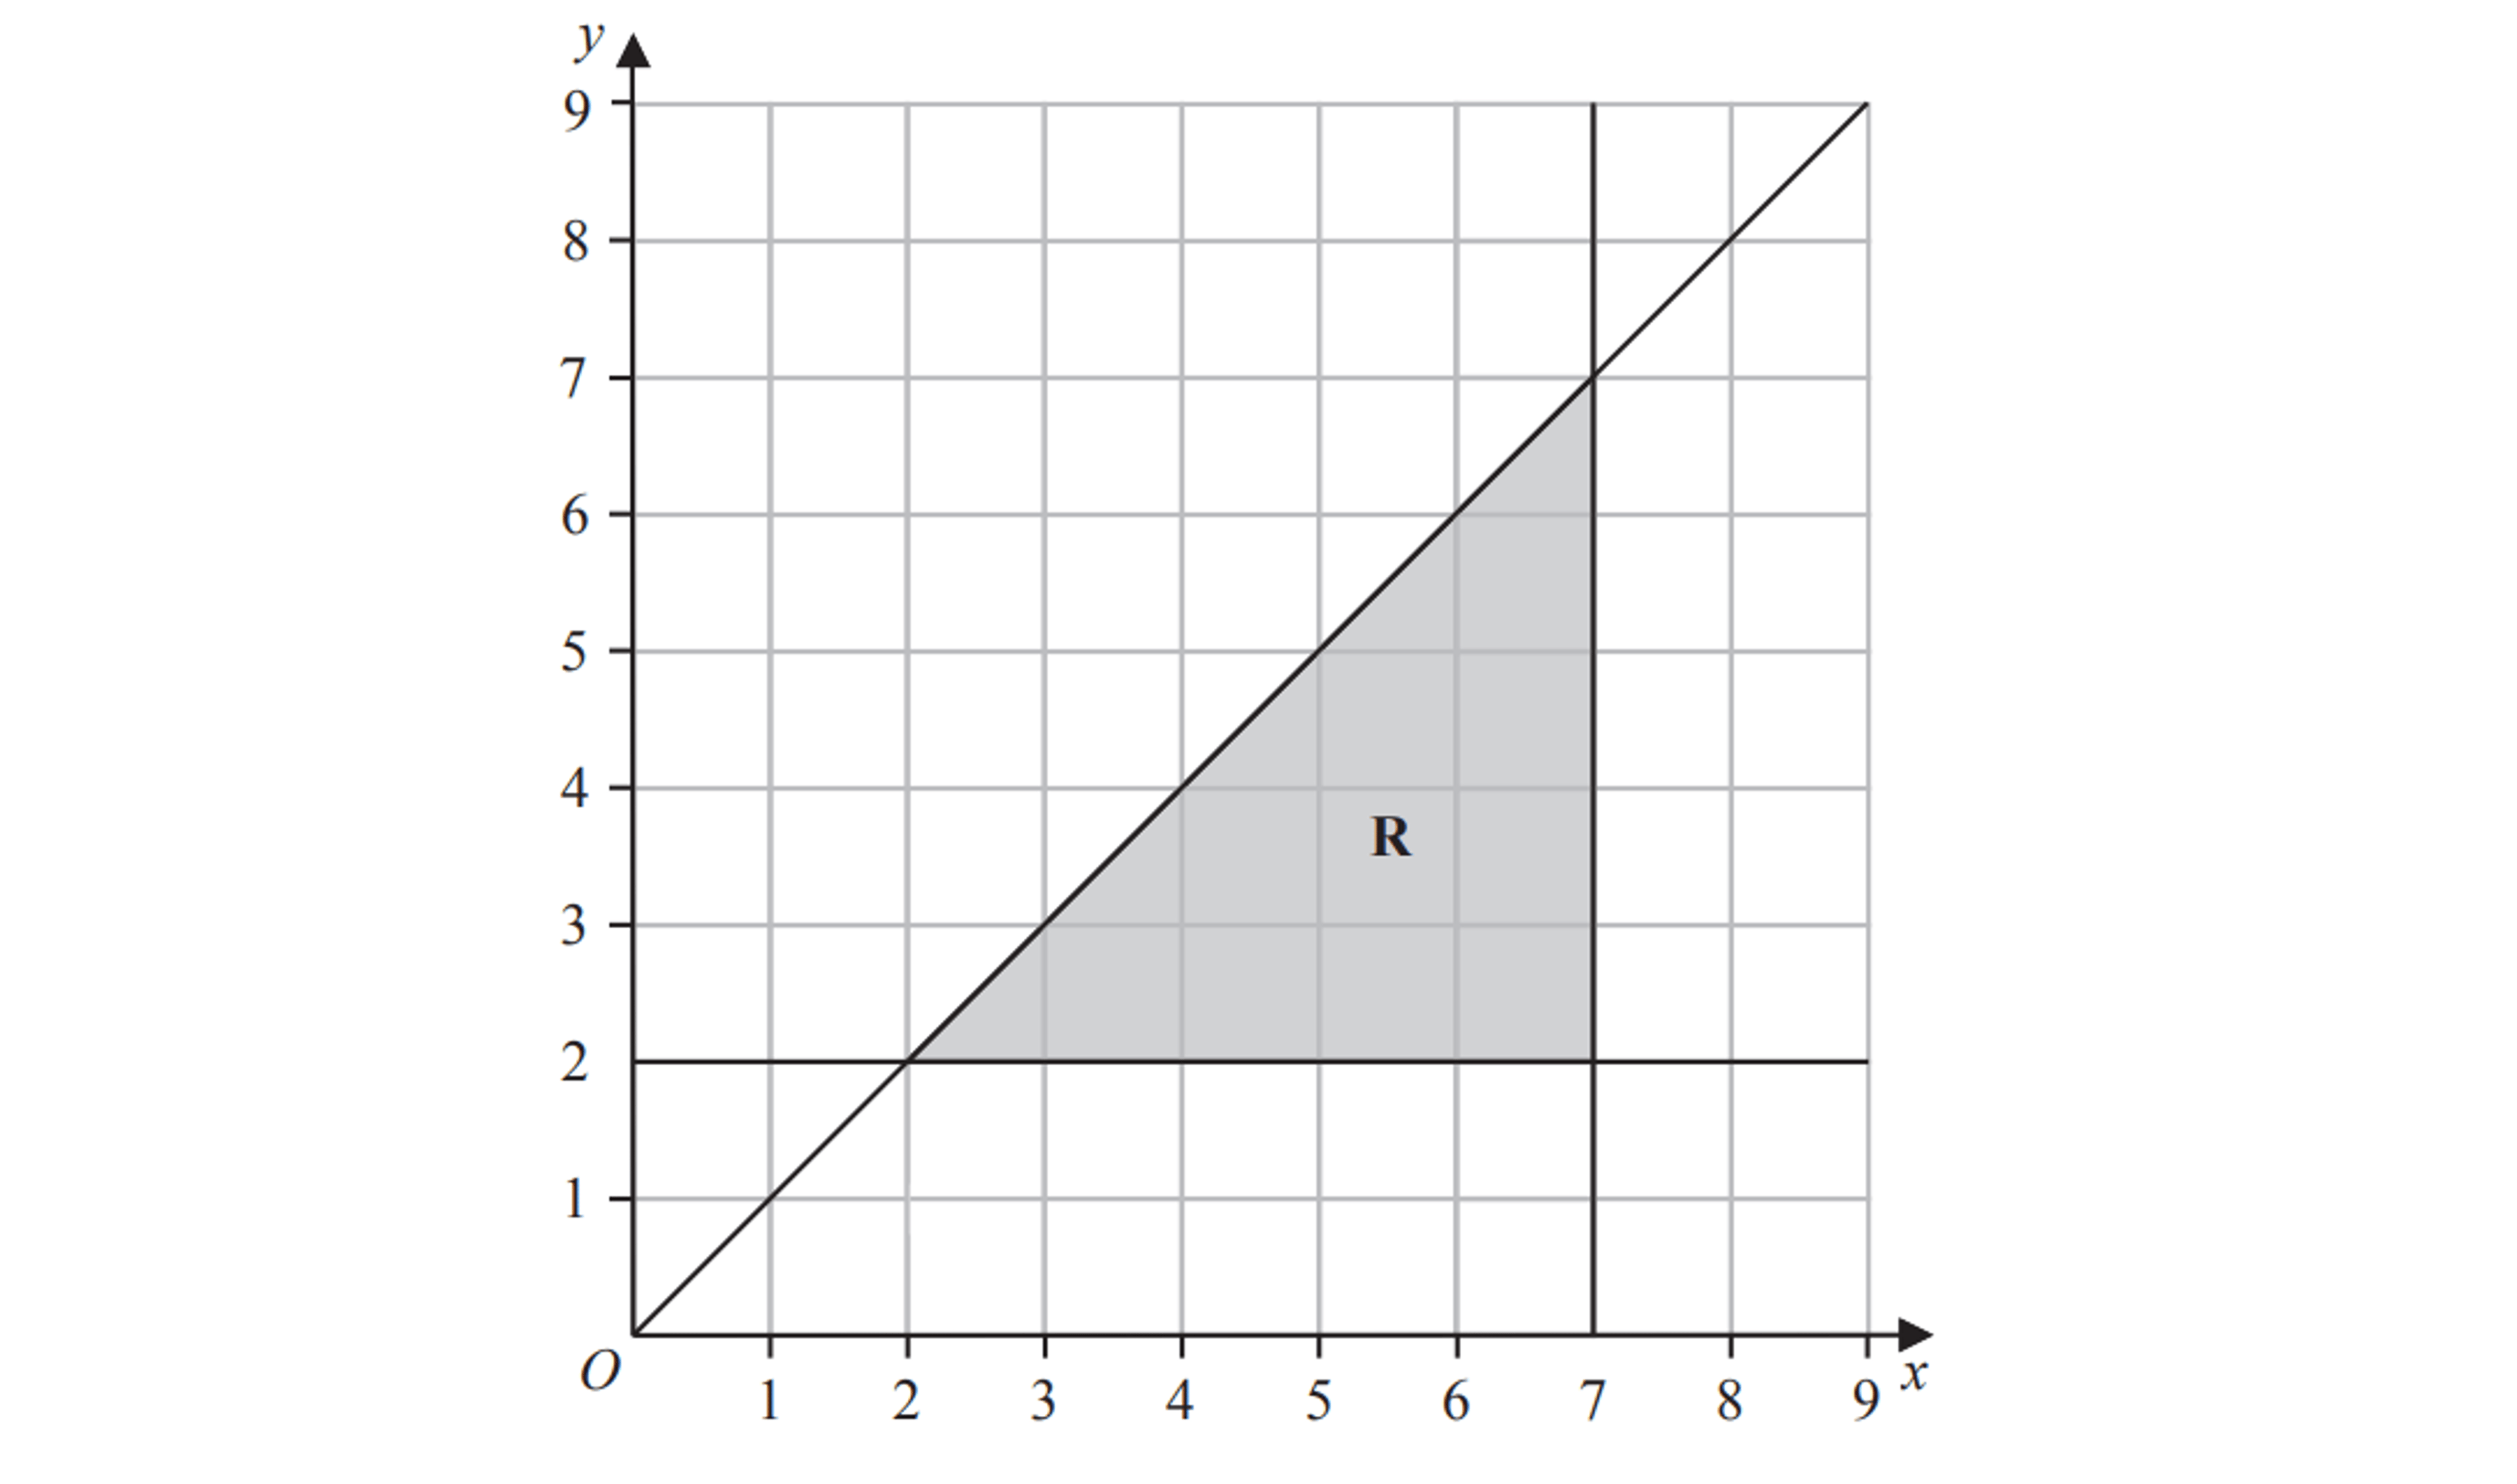
Write down the three inequalities that define the region R
Was this exam question helpful?