Mass Spectrum of an Element (College Board AP® Chemistry): Study Guide

Mass spectrum of an element
The mass and relative abundance of each isotope of an element in a sample can be determined using a mass spectrometer
A mass spectrometer provides this information in the form of a mass spectrum
Sample mass spectrum
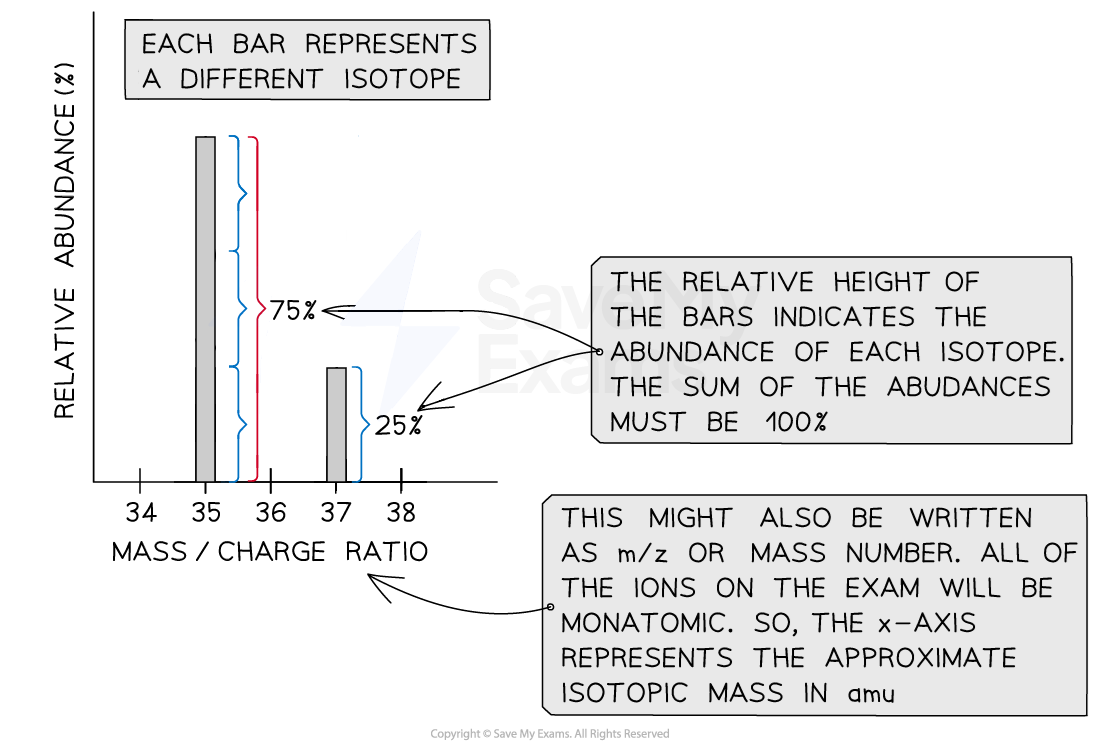
The two peaks show that chlorine-35 makes up about 75% and chlorine-37 about 25% of chlorine atoms, which is why chlorine's average atomic mass (35.45 amu) is closer to 35
The average atomic mass can be estimated and the identity of an element determined using the approximate isotopic mass and abundance from a mass spectrum
Each peak is one isotope:
Its position on the x-axis gives the isotope's mass
Its height gives the isotope's relative abundance
The abundances of all the peaks add up to 100%
Worked Example

Based on the mass spectrum of a pure element shown above, what is the most likely identity of the element?
(A) Cu
(B) Zn
(C) Ga
(D) Ni
Answer:
The average atomic mass of an element must fall between the masses of its lightest and heaviest isotopes
The element cannot be Ni (58.69 amu)
The average atomic mass will most likely be close in value to the mass of the isotope with the highest abundance
The element cannot be Ga (69.72 amu)
The average atomic mass of the element will be near 64 amu, but the element also has isotopes of significant abundance with masses of 66 and 68
This will skew the average atomic mass to be greater than 64 amu
So, the element is Zn (65.38 amu), option (B), not Cu (63.55 amu)
Examiner Tips and Tricks
Don't confuse a mass spectrum with a photoelectron spectrum: a mass spectrum plots isotope mass against relative abundance.
When asked why two isotopes have different masses, say they have different numbers of neutrons; they have the same number of protons and electrons.
On the exam you will only interpret spectra of a single element made of singly charged atoms.

Unlock more, it's free!
Join the 100,000+ Students that ❤️ Save My Exams
the (exam) results speak for themselves:

Was this revision note helpful?
Build on this topic