The Cardiac Cycle (AQA A Level Biology): Revision Note
Exam code: 7402

The cardiac cycle
The cardiac cycle is the series of events that take place in one heart beat, including muscle contraction and relaxation
The contraction of the heart is called systole, while the relaxation of the heart is called diastole
Volume changes occur in the heart during the cardiac cycle
Contraction of the heart muscle causes a decrease in volume in the corresponding chamber of the heart, which then increases again when the muscle relaxes
Volume changes lead to corresponding pressure changes
When volume decreases, pressure increases
When volume increases, pressure decreases
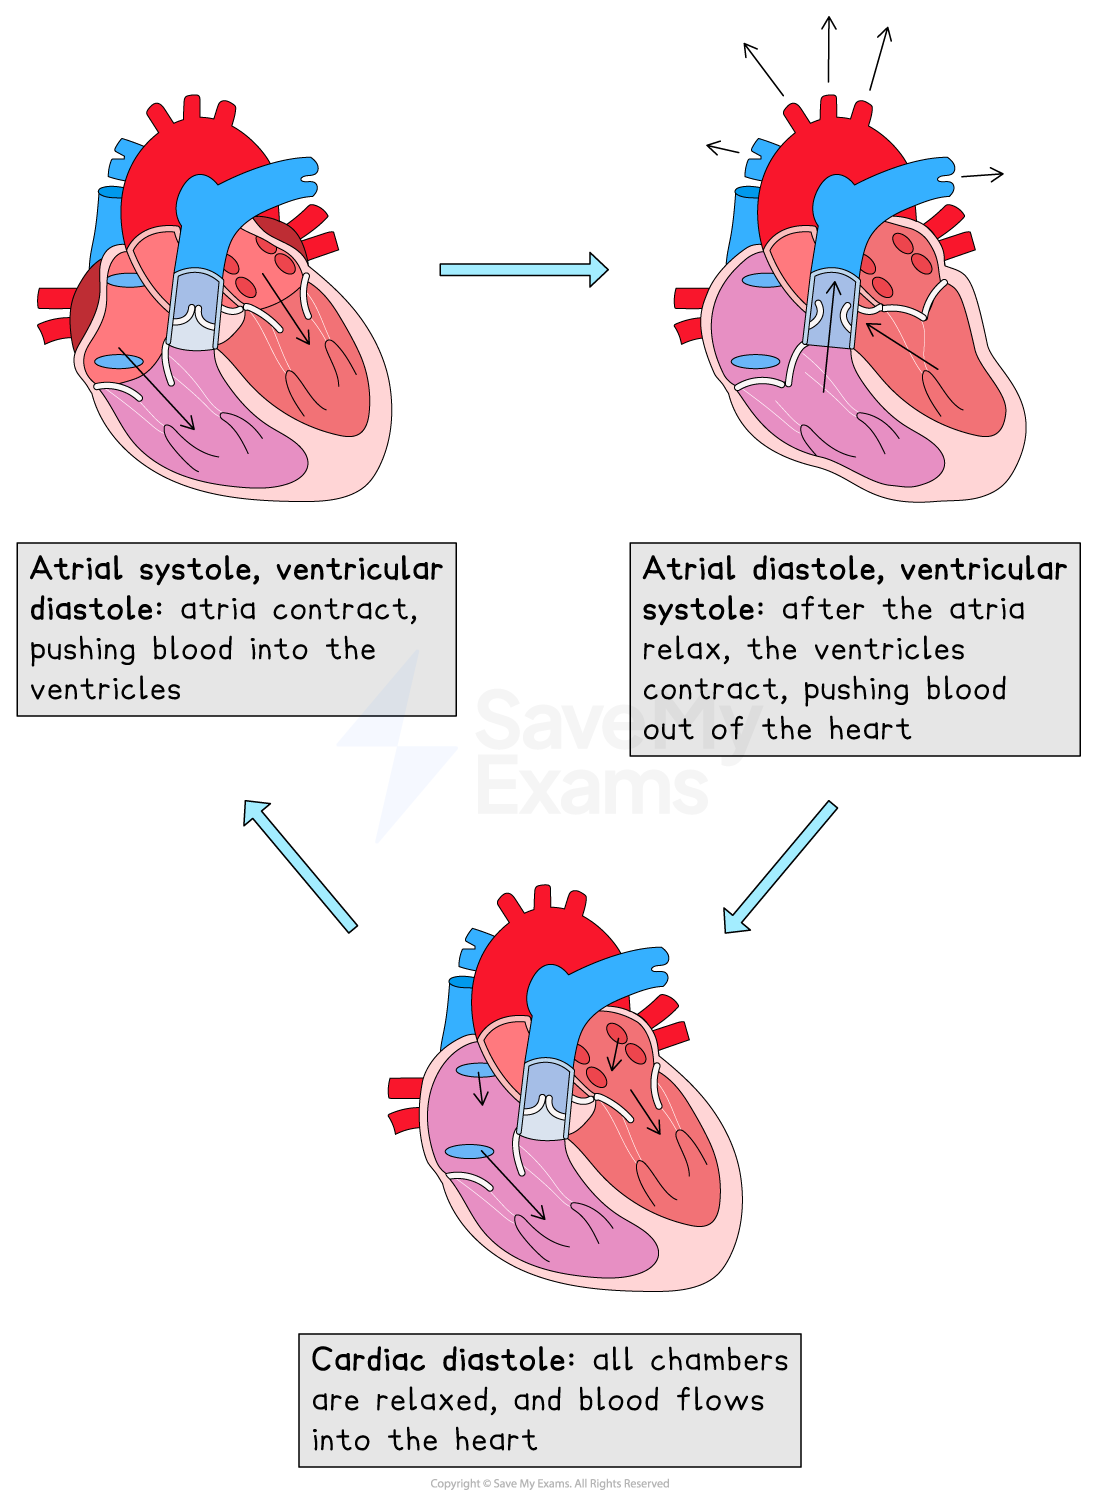
The events of the cardiac cycle
Atrial systole
The walls of the atria contract
Atrial volume decreases
Atrial pressure increases
The pressure in the atria rises above that in the ventricles, forcing the atrioventricular (AV) valves open
Blood is forced into the ventricles
There is a slight increase in ventricular pressure and chamber volume as the ventricles receive the blood from the atria
The ventricles are relaxed at this point; ventricular diastole coincides with atrial systole
Ventricular systole
The walls of the ventricles contract
Ventricular volume decreases
Ventricular pressure increases
The pressure in the ventricles rises above that in the atria
The AV valves are forced to close, preventing back flow of blood
The pressure in the ventricles rises above that in the aorta and pulmonary artery
The semilunar (SL) valves are forced open so blood is forced into the arteries and out of the heart
During this period:
the atria are relaxing; atrial diastole coincides with ventricular systole
the blood flow to the heart continues, so the relaxed atria begin to fill with blood again
Diastole
The ventricles and atria are both relaxed
The pressure in the ventricles drops below that in the aorta and pulmonary artery, forcing the SL valves to close
The atria continue to fill with blood
Blood returns to the heart via the vena cava and pulmonary vein
Pressure in the atria rises above that in the ventricles, forcing the AV valves open
Blood flows passively into the ventricles without need for atrial systole
The cycle then begins again with atrial systole
Valve movements during the cardiac cycle
Pressure changes cause the valves to open and close in different regions of the heart
Valves open when the pressure of blood behind them is greater than the pressure in front of them
They close when the pressure of blood in front of them is greater than the pressure behind them
Stage in cardiac cycle | Atrioventricular valves | Semilunar valves |
|---|---|---|
Atrial systole | Open | Closed |
Ventricular systole | Closed | Open |
Diastole | Open | Closed |
Analysing data relating to the cardiac cycle
The changes that occur during the cardiac cycle can be shown on a graph, e.g.:
The lines on the graph below represent the pressure of the left atrium, aorta, and the left ventricle
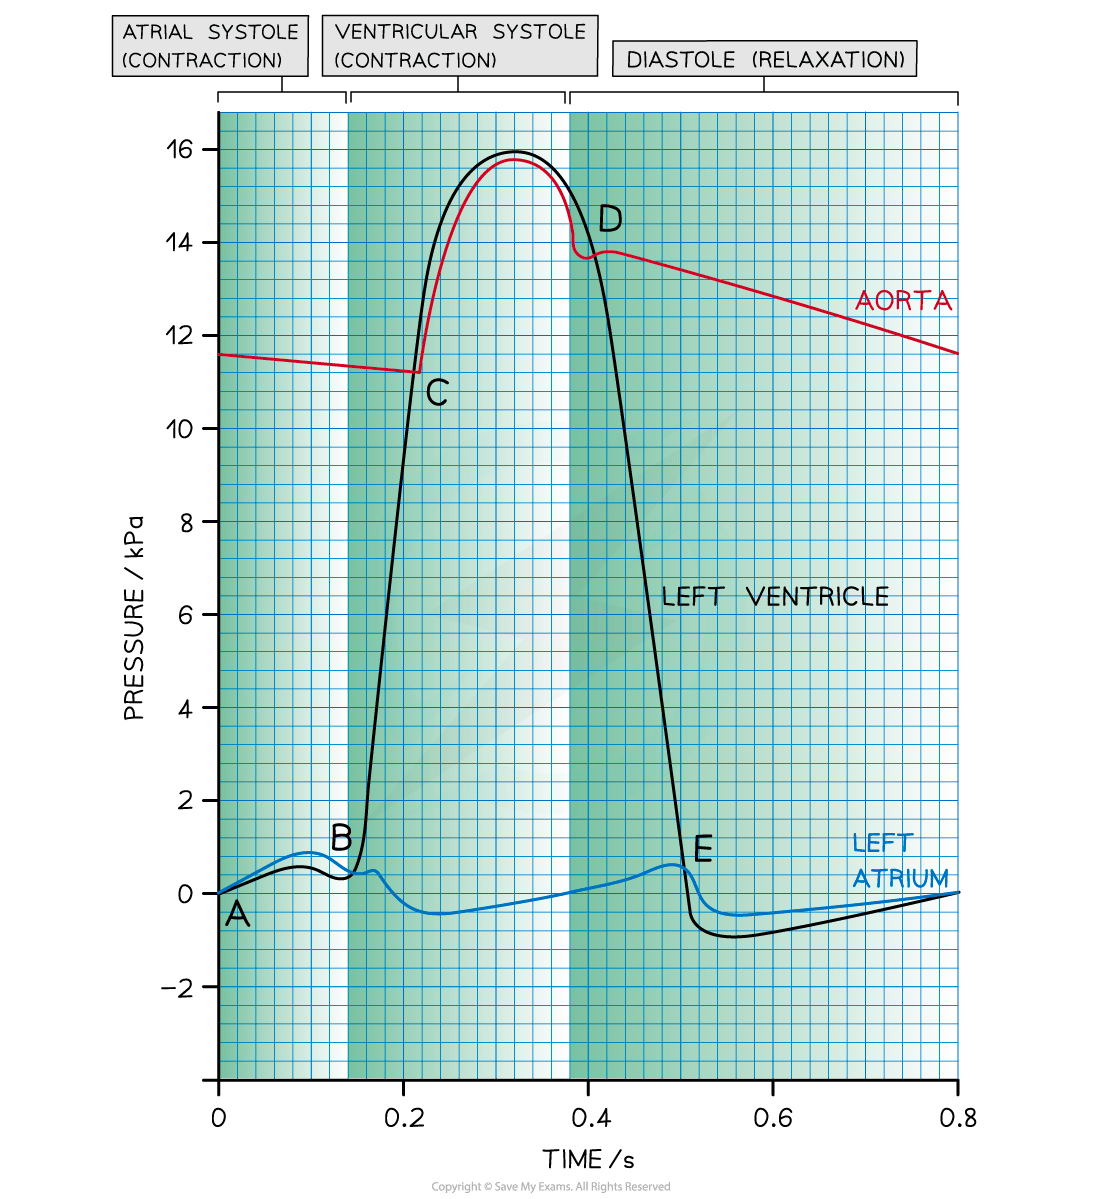
Interpreting the cardiac cycle graph
Point A: the end of diastole
The atrium has filled with blood during the preceding diastole
Pressure is higher in the atrium than in the ventricle, so the AV valve is open
Point A-B: atrial systole
Left atrium contracts, causing an increase in atrial pressure and forcing blood into the left ventricle
Ventricular pressure increases slightly as it fills with blood
Pressure is higher in the atrium than in the ventricle, so the AV valve is open
Point B: beginning of ventricular systole
Left ventricle contracts causing the ventricular pressure to increase
Pressure in the left atrium drops as the muscle relaxes
Pressure in the ventricle exceeds pressure in the atrium, so the AV valve shuts
Point C: ventricular systole
The ventricle continues to contract
Pressure in the left ventricle exceeds that in the aorta
Aortic valve opens and blood is forced into the aorta
Point D: beginning of diastole
Left ventricle has been emptied of blood
Muscles in the walls of the left ventricle relax and pressure falls below that in the newly filled aorta
Aortic valve closes
Point D-E: early diastole
The ventricle remains relaxed and ventricular pressure continues to decrease
In the meantime, blood is flowing into the relaxed atrium from the pulmonary vein, causing an increase in pressure
Point E: diastole
The relaxed left atrium fills with blood, causing the pressure in the atrium to exceed that in the newly emptied ventricle
AV valve opens
After point E: late diastole
There is a short period of time during which the left ventricle expands due to relaxing muscles
This increases the internal volume of the left ventricle and decreases the ventricular pressure
At the same time, blood is flowing slowly through the newly opened AV valve into the left ventricle, causing a brief decrease in pressure in the left atrium
The pressure in both the atrium and ventricle then increases slowly as they continue to fill with blood
Worked Example
The graph below shows the cardiac cycle.
Calculate the heart rate of this person. Give your answer in beats per minute.

Answer:
Step 1: work out the length of one heart beat
It takes 0.7 seconds for completion of one cardiac cycle, which is one heart beat
1 cycle = 0.7 seconds
Step 2: calculate how many heart beats occur per second
Determine the number of times 0.7 fits into 1 second
1 ![]() 0.7 = 1.43 beats per second
0.7 = 1.43 beats per second
Step 3: calculate how many heart beats occur per minute
1 minute = 60 seconds
1.43 x 60 = 85.71 beats beats / min
Examiner Tips and Tricks
Make sure that you can point out the times on a cardiac cycle graph at which different valves are opening and closing.

Unlock more, it's free!
Join the 100,000+ Students that ❤️ Save My Exams
the (exam) results speak for themselves:

Was this revision note helpful?
