1a
1 mark
Define the term position.
1b
3 marks
Identify whether position is a scalar or vector quantity.
⎽⎽⎽⎽⎽⎽⎽⎽⎽⎽ scalar ⎽⎽⎽⎽⎽⎽⎽⎽⎽⎽ vector
Justify your reasoning.
Was this exam question helpful?
Define the term position.
Identify whether position is a scalar or vector quantity.
⎽⎽⎽⎽⎽⎽⎽⎽⎽⎽ scalar ⎽⎽⎽⎽⎽⎽⎽⎽⎽⎽ vector
Justify your reasoning.
Was this exam question helpful?
Define the term displacement.
Compare displacement and distance.
Was this exam question helpful?
Define the term velocity.
Justify why speed is described as a scalar quantity but velocity is described as a vector.
Two students are discussing speed and velocity. Student A makes the following claim:
"Instantaneous speed is the magnitude of instantaneous velocity, but average speed is not the magnitude of average velocity."
Identify whether Student A is correct or incorrect.
⎽⎽⎽⎽⎽⎽⎽⎽⎽⎽ correct ⎽⎽⎽⎽⎽⎽⎽⎽⎽⎽ incorrect
Justify your reasoning.
Was this exam question helpful?
Define the term acceleration.
Explain what information a negative value of acceleration provides.
Was this exam question helpful?
A group of students is investigating the motion of a cart along a track. The cart's position is recorded at different times in the table below.
Time (s) | Position (m) |
|---|---|
0.0 | 1.0 |
1.0 | 2.5 |
2.0 | 4.5 |
3.0 | 7.0 |
4.0 | 10.0 |
Describe how the data can be used to determine the displacement of the cart.
Describe how the data from part a) can be used to determine the average velocity of the cart.
Was this exam question helpful?
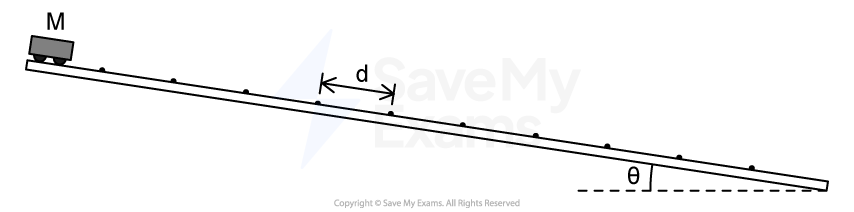
Figure 1
A long track, inclined at an angle ![]() to the horizontal, has small speed bumps on it. The bumps are evenly spaced a distance
to the horizontal, has small speed bumps on it. The bumps are evenly spaced a distance ![]() apart, as shown in Figure 1. The track is actually much longer than shown, with over 100 bumps. A cart of mass
apart, as shown in Figure 1. The track is actually much longer than shown, with over 100 bumps. A cart of mass ![]() is released from rest at the top of the track. A student notices that after reaching the 40th bump, the cart's average speed between successive bumps no longer increases, reaching a maximum value
is released from rest at the top of the track. A student notices that after reaching the 40th bump, the cart's average speed between successive bumps no longer increases, reaching a maximum value ![]() . This means the time taken to move from one bump to the next becomes constant.
. This means the time taken to move from one bump to the next becomes constant.
Consider the cart's motion between bump 41 and bump 44.
i) On the axes provided in Figure 2, sketch a graph of the cart's velocity ![]() as a function of time from the moment it reaches bump 41 until it reaches bump 44.
as a function of time from the moment it reaches bump 41 until it reaches bump 44.
ii) On your graph, draw and label a line for the maximum average speed ![]() for the same time interval.
for the same time interval.

Figure 2
Derive an expression for the time ![]() taken for the cart to travel between two successive bumps. Write your expression in terms of
taken for the cart to travel between two successive bumps. Write your expression in terms of ![]() ,
, ![]() ,
, ![]() , and physical constants as appropriate. Begin your derivation by writing a fundamental physics principle or an equation from the reference booklet.
, and physical constants as appropriate. Begin your derivation by writing a fundamental physics principle or an equation from the reference booklet.
Was this exam question helpful?
One end of an elastic climbing rope is fixed to the top of a crane. The other end of the rope is connected to a block which is initially at position A. The block is released from rest. The mass of the rope is negligible.

The full length of the rope is 60.0 m. From position A to B, the block falls freely with acceleration ![]() .
.
Identify whether the acceleration ![]() of the block is less than, equal to, or greater than
of the block is less than, equal to, or greater than ![]() .
.
⎽⎽⎽⎽⎽⎽⎽⎽⎽⎽ ![]() ⎽⎽⎽⎽⎽⎽⎽⎽⎽⎽
⎽⎽⎽⎽⎽⎽⎽⎽⎽⎽ ![]() ⎽⎽⎽⎽⎽⎽⎽⎽⎽⎽
⎽⎽⎽⎽⎽⎽⎽⎽⎽⎽ ![]()
Justify your reasoning.
Between positions B and C, the resultant force on the block changes because the tension in the rope increases as the rope extends.
A student makes the following claim:
"A kinematic equation can be used to find the vertical velocity of the lock at position B."
Identify whether the student's claim is correct or incorrect.
⎽⎽⎽⎽⎽⎽⎽⎽⎽⎽ correct ⎽⎽⎽⎽⎽⎽⎽⎽⎽⎽ incorrect
Justify your answer.
Was this exam question helpful?

Figure 1
Figure 1 shows the flight path of a drone conducting a LiDAR (Light Detection and Ranging) scan of a ranch in Utah. The drone flies a grid pattern consisting of 500 m horizontal paths which shift to the north by 50 m with each pass.
Estimate the distance covered by drone during its flight.
Determine the displacement of the LiDAR drone. Justify your answer.
Was this exam question helpful?
A sprinter runs a ![]() race. Starting from rest, the sprinter covers
race. Starting from rest, the sprinter covers ![]() in
in ![]() and accelerates at a constant rate. The remaining distance is covered at a constant velocity equal to that which the sprinter had at the end of their period of acceleration.
and accelerates at a constant rate. The remaining distance is covered at a constant velocity equal to that which the sprinter had at the end of their period of acceleration.
Determine the total time required by the sprinter to complete the race.
On the axes provided in Figure 1, sketch a graph of the position of the sprinter as a function of time.

Was this exam question helpful?