1
3 marks
On the grid, draw the graph of ![]() for values of
for values of ![]() from –2 to 3
from –2 to 3
Was this exam question helpful?
Exam code: 4MA1
On the grid, draw the graph of ![]() for values of
for values of ![]() from –2 to 3
from –2 to 3
Was this exam question helpful?
On the grid below, draw the graph of ![]() for values of
for values of ![]() from − 2 to 3
from − 2 to 3
Was this exam question helpful?
The diagram shows a hexagon ![]()
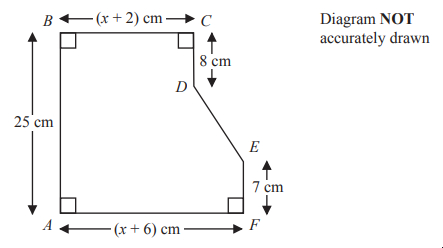
![]()
The area of hexagon ![]() is 258 cm²
is 258 cm²
Work out the value of ![]()
Was this exam question helpful?