1
4 marks
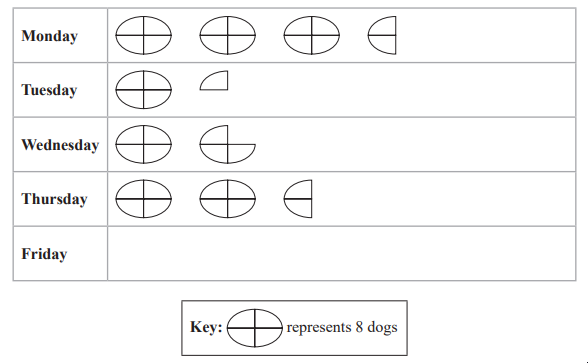
The pictogram shows information about the number of goals scored by each of five hockey teams in March.
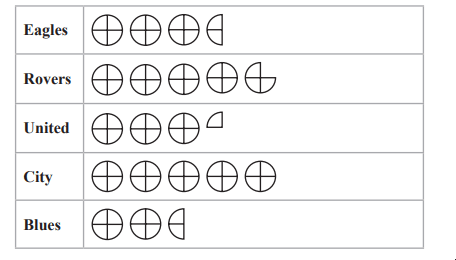
The total number of goals scored in March by the five hockey teams was 152
How many goals did City score in March?
Was this exam question helpful?