Mean & Standard Deviation (AQA A Level Biology): Revision Note
Exam code: 7402

Calculating mean values & standard deviation
Descriptive statistics are invaluable when interpreting data from experiments
Some experiments have thousands or millions of data values/observations, and descriptive statistics allow for sample data to be summarised in a concise manner
Mean
A mean value is what is usually meant by “an average” in biology
mean = sum of all measurements ÷ number of measurements
Problems with the mean occur when a dataset contains extreme, or outlying values, which can make the mean too high or too low to represent the data
The mean is sometimes referred to as X̄ in calculations
Worked Example
Fifteen rats were timed to see how long it took them to reach the end of a maze puzzle. Their times, in seconds, are given below.
Calculate the mean time.
12, 10, 15, 14, 17,
11, 12, 13, 9, 21,
14, 20, 19, 16, 23
Answer:
Step 1: calculate the mean
12 + 10 + 15 + 14 + 17 + 11 + 12 + 13 + 9 + 21 + 14 + 20 + 19 + 16 + 23 = 226
226 ÷ 15 = 15.067
Step 2: round to 3 significant figures
Mean (X̄) = 15.1 seconds
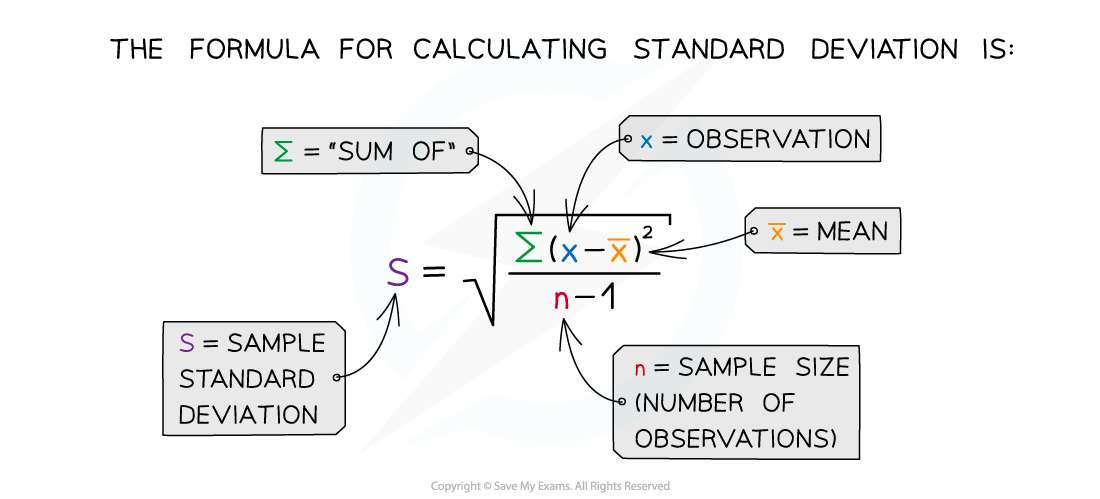
Standard deviation
The mean is a more informative statistic when it is provided alongside standard deviation
Standard deviation measures the spread of data around the mean value
It is useful when comparing consistency between different data sets
The mean must be calculated before working out the standard deviation
Examiner Tips and Tricks
You will not be required to calculate standard deviations in written papers, but you may need to calculate the standard deviation as part of practical work and investigations. You must understand what the standard deviation tells you about a data set as you may be asked to interpret mean values and their standard deviations.
Worked Example
The ear lengths of a population of rabbits were measured:
Ear length (mm) | 62, 60, 59, 61, 60, 58, 59, 60, 57, 56, 59, 58, 60, 59, 57 |
Calculate the mean and standard deviation.
Step 1: calculate the mean
mean = 885 ÷ 15 = 59 mm
Step 2: find the difference between each value and the mean
Subtract the mean from each value to find the difference
Example:
62 - 59 = 3
Step 3: square each difference (to remove any negative values)
Example:
32 = 9
Step 4: total the differences
Difference between value and mean (x - x̄) | Difference between value and mean squared (x - x̄)2 |
|---|---|
62 - 59 = 3 | 9 |
60 - 59 = 1 | 1 |
59 - 59 = 0 | 0 |
61 - 59 = 2 | 4 |
60 - 59 = 1 | 1 |
58 - 59 = -1 | 1 |
59 - 59 = 0 | 0 |
60 - 59 = 1 | 1 |
57 - 59 = -2 | 4 |
56 - 59 = -3 | 9 |
59 - 59 = 0 | 0 |
58 - 59 = -1 | 1 |
60 - 59 = 1 | 1 |
59 - 59 = 0 | 0 |
57 - 59 = -2 | 4 |
Sum of (x - x̄)2 | 36 |
Step 5: divide the total by (n-1) to get value A
36 ÷ (15 - 1)
= 36 ÷ 14
= 2.571
Step 6: determine the square root of value A
![]() = 1.604
= 1.604
Standard deviation = 1.60
This value is small compared to the mean value (59 mm), indicating that there is little spread around the mean.

Unlock more, it's free!
Join the 100,000+ Students that ❤️ Save My Exams
the (exam) results speak for themselves:

Was this revision note helpful?