Data-Based Questions (DP IB Biology: HL): Exam Questions

2 hours9 questions
1a1 mark

Disease X is a potentially fatal disease found in sea urchins, with symptoms such as body deflation, body lesions, and discolouration. The cause of disease X has yet to be determined, and several hypotheses have been tested. 

One such study investigated the possible connection between the presence of viruses known as densoviruses and disease X in several species of sea urchin.

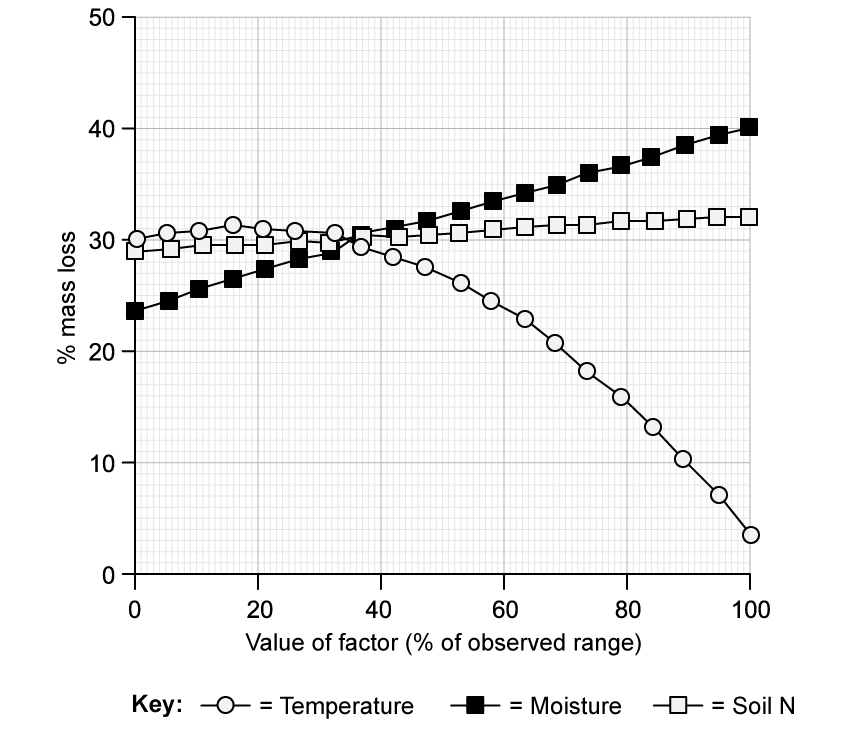
Some of the results of the study are shown in the graph.

Bar chart showing densovirus viral load in three sea urchin species. Species 3 with symptoms has significantly higher load. Key indicates symptom presence.

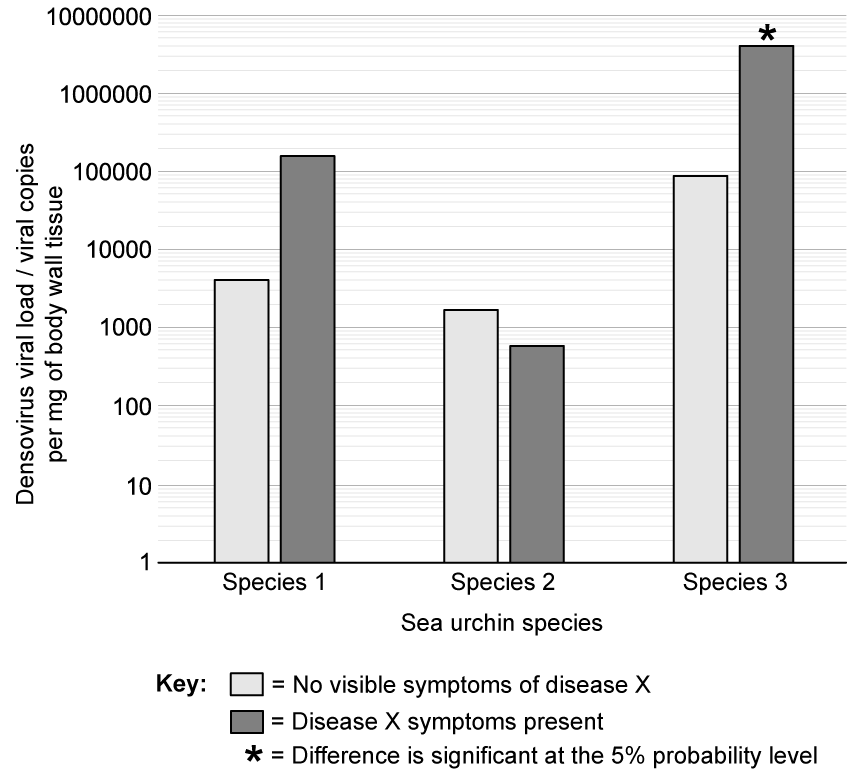
State the viral load of species 1 when no symptoms are present.

1b2 marks

Contrast the relationship between viral load and disease X symptoms in the different species studied.

1c3 marks

Aquatic organisms have a thin layer of water surrounding their bodies that is known as the diffusive boundary layer (DBL). Organisms exchange substances with their environment via this layer, and its composition is different to that of the surrounding seawater. 

Another study looked at the impact of the composition of the DBL on the development of disease X.  Two types of organic matter were added to the water surrounding sea urchins of species 2: 

  • Organic matter in the form of lab-grown algae

  • Seawater containing normal levels of organic matter

The sea urchins were assessed over 10 days for signs of disease X lesions and the water in the DBL was tested for bacteria. Note that the control contained no additional organic matter.

Two line graphs showing change in the number of sea urchins without disease over time, and changes in the number of bacteria over 10 days with control, algae, and seawater treatments.

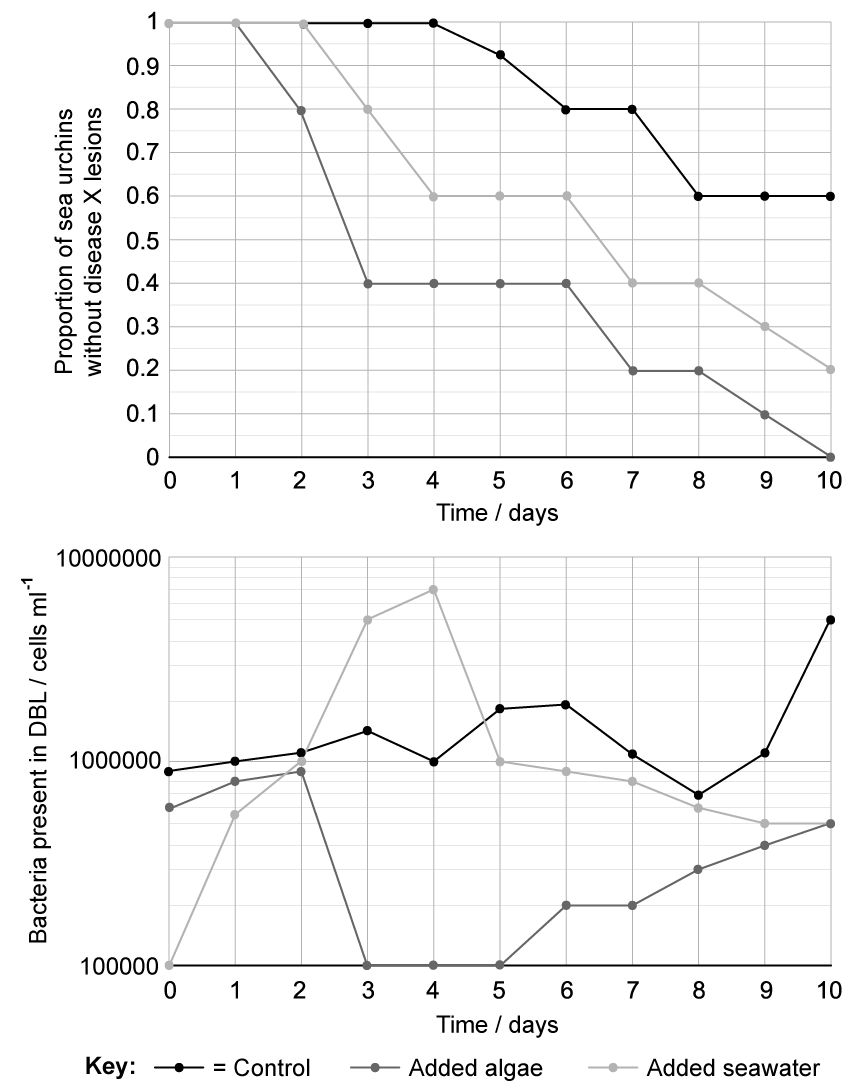
Describe the effect of DBL composition on formation of disease X lesions over the testing period.

1d3 marks

Discuss the relationship between the growth of disease X lesions and the abundance of bacteria in the DBL shown in part (c).

1e1 mark

As part of the same study the researchers looked at the impact of reduced oxygen levels in the DBL on lesion growth in a fourth species of sea urchin.

Their results are shown in the graph below.

Line graph showing the proportion of sea urchins without disease over 10 days; control remains disease-free, while the proportion of disease-free urchins living with depleted oxygen decreases over time.

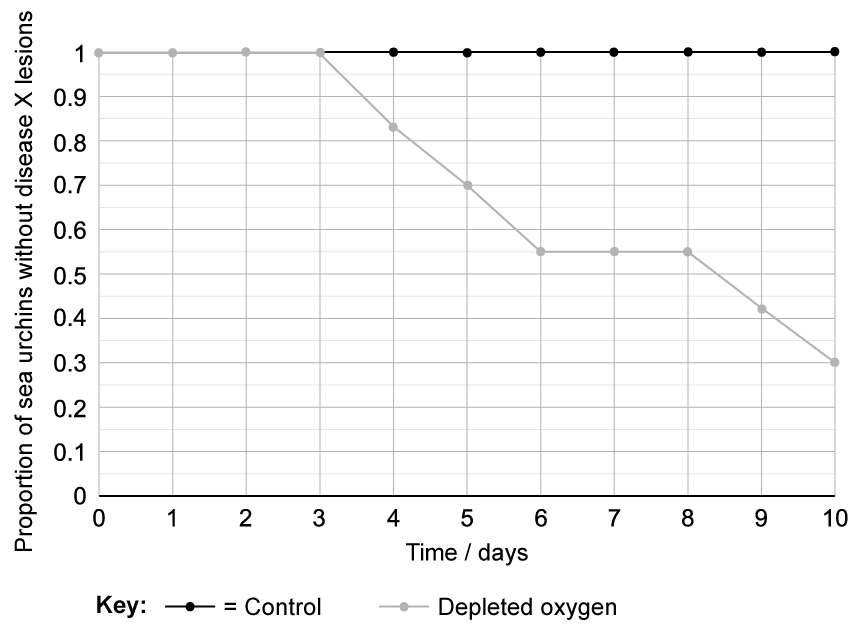
Calculate the number of individuals that would have lesions after 10 days with depleted oxygen levels in a population of 23.

1f2 marks

Suggest how depleted oxygen might lead to the increase in growth of disease X lesions shown in part (e).

1g3 marks

A student read the results described in parts (c) and (e) and concluded that disease X is caused by an increase in organic matter and a decrease in oxygen levels in the DBL of sea urchins.

Evaluate the student’s conclusion.

2a1 mark

Different ecosystems have different levels of productivity due to differences in the abiotic and biotic factors in the environment.

The cycling of nutrients in an ecosystem determines the nutrients available to plants for growth and therefore has a direct impact on the net primary productivity (NPP) of that ecosystem.

The table shows the decomposition cycles of 6 different vital nutrients across three different biomes, as well as the NPP for each biome.

Note that a decomposition cycle is the number of years it takes for a nutrient in dead organic matter to be made available again to plants

Time needed for 1 cycle of decomposition/years

C

P

N

K

Ca

Mg

NPP

G C m-2 yr-1

Boreal Forest

146.0

143.0

100.5

37.5

56.0

197

140

Mediterranean Forest

3.5

4.7

4.9

1.4

2.5

3.7

600

Tropical Forest

0.3

2.1

1.8

0.9

1.1

0.9

2200

Identify the biome that shows the slowest rate of decomposition.

2b1 mark

Suggest a biotic factor which may impact decomposition rates in an ecosystem.

2c2 marks

List two carbon-containing compounds found in plants.

2d2 marks

Describe the relationship between net primary productivity (NPP) and decomposition rate for the three biomes.

2e1 mark

A study was conducted to establish the relationship between different abiotic factors and the rate of decomposition in a Mediterranean Forest ecosystem.

The data can be seen in the graph below.

Line graph showing mass loss percentage against factor value percentage. Temperature decreases, moisture increases, soil nitrogen remains stable.

Identify the abiotic factor that produced the biggest change in the rate of decomposition. 

2f3 marks

Describe the effects of the different abiotic factors on decomposition.

2g2 marks

Explain the effect of temperature on decomposition rate.

2h2 marks

Using the data provided, deduce why tropical forests have the highest rate of productivity of the 3 biomes studied.

3a2 marks

EDTA is a chemical that reacts with metal ions to form a stable, harmless compound. It is commonly used to reduce levels of calcium in many medical procedures, e.g. during dental work. EDTA has also been shown to have antimicrobial properties that are effective in the treatment of Staphylococcus aureus infections. 

Scientists wanted to establish how effective EDTA could be in the treatment of infection with Escherichia coli bacteria. The growth of E.coli bacteria was monitored in response to treatment with EDTA over a period of 5 days.

The chart below shows the results.

Bar graph showing cell count per 10,000 cm³. Two sets: dark grey bars (no EDTA) and light grey bars (1% EDTA) across conditions 0 to 5.

Explain why a group with no EDTA treatment has been included in the study.

3b
Sme Calculator
1 mark

Calculate the percentage difference between the number of bacteria in the sample treated with EDTA and the number of bacteria in the untreated sample after 5 days.

3c2 marks

Outline the effect of EDTA on the growth of E. coli populations.

3d1 mark

The presence of antibiotic resistance within E.coli populations was studied and the results are presented in the graph below.

Line graph showing antibiotic resistance from 2002 to 2012. Amoxicillin increases sharply, Tetracycline rises moderately, EDTA and Pivmecillinam low resistance.

Which antibiotic has been shown to be the least effective against E.coli?

3e3 marks

Describe the levels of antibiotic resistance in E. coli across the antibiotics studied.

Note that no additional marks will be awarded for naming the least effective antibiotic, as this was addressed in part (d).

3f5 marks

The table below shows some of the side effects associated with the antibiotics studied.

Antibiotic

Side effects

EDTA

Abdominal cramps, nausea, vomiting, diarrhoea, headache, low blood pressure, skin problems and fever

Amoxicillin

Abdominal cramps, back and leg pains, bloating, blood in urine, chest pains

Tetracycline

Nausea, vomiting, diarrhoea, loss of appetite, mouth sores, black hairy tongue, sore throat, headache

Pivmecillinam hydrochloride

Diarrhoea, feeling sick, thrush

Using all the information provided, evaluate whether EDTA is the best antibiotic to treat E.coli.

3g2 marks

Suggest 2 different methods that could be used to help reduce the development of antibiotic resistance.

4a2 marks

Agriculturalists in Mozambique investigated how planting density and nitrogen fertiliser affected yield in sweet potato plants (Ipomoea batatas).

Nitrogen was supplied, in the form of urea (CH₄N₂O), at three application rates (30, 35 and 40 g m⁻²). This was tested in combination with three plant spacings (16, 20 and 25 cm).

The mean underground dry mass per plant, and mean crop yield, were recorded after 175 days of growth. All other growing conditions were kept constant.

Spacing distance / cm

Urea level / g m⁻²

Mean underground dry mass / g per plant

Mean crop yield / tonnes per hectare

16

30

30

12.9

16

35

54

21.4

16

40

58

19.8

20

30

17

7.6

20

35

148

40.3

20

40

141

35.6

25

30

42

10.8

25

35

187

12.8

25

40

15

8.4

(1 hectare = 10 000 m²)

Describe the overall effect of nitrogen addition on yield of sweet potato plants.

4b3 marks

(i) Identify the conditions that produced the highest yield.

[1]

(ii) Calculate the percentage difference in yield for the highest yield compared to the lowest yield.

[2]

4c4 marks

The agriculturalists also investigated the mass of plant matter above ground (both fresh mass and dry mass). This was measured against leaf length and crop yield at the three levels of urea previously tested. All these data were gathered from sweet potato plants spaced at 20 cm distance. The results are shown in the graph below.

Bar and line graph showing effects of urea levels (30, 35, 40 gm/m²) on plant mass, leaf length, and crop yield. Peak yield at 35 gm/m², key included.

The scientists concluded that the following planting regime should be recommended to farmers:

  • plants spaced 20 cm apart

  • more than 35 g m-2 urea

Evaluate the scientists' conclusion, using the data above and from part a).

4d4 marks

Explain how the use of nitrogen fertiliser can lead to eutrophication in nearby aquatic ecosystems.

4e3 marks

Discuss how increasing agricultural productivity can affect biodiversity in surrounding ecosystems.

5a2 marks

Bananas with less starch and more sugar are sweeter and ripen faster. Scientists identified a bacterial enzyme that decreases starch production and transferred its gene into bananas to create transgenic lines with lower starch content.

The table below shows the mean starch and sugar content of three control banana lines and three transgenic lines.

Banana line

Starch / % fresh weight

Sugar / % fresh weight

Control 1

7.21

1.34

Control 2

6.48

3.54

Control 3

8.33

2.87

Mean (control)

7.34

2.58

Transgenic 1

1.45

3.65

Transgenic 2

2.76

5.78

Transgenic 3

2.94

4.22

Mean (transgenic)

2.38

4.55

(i) Identify the line of transgenic bananas that has the highest sugar content.

[1]

(ii) Calculate the difference in the mean percentage of starch in control and transgenic bananas.

[1]

5b4 marks

(i) Compare the mean starch and mean sugar content of the control and transgenic banana lines.

[1]

(ii) Explain how transferring the bacterial gene changes carbohydrate composition in transgenic bananas.

[3]

5c2 marks

Bananas were harvested from trees and stored. Sample bananas were removed from storage after 2, 4, 6 or 8 days. The colour of the bananas was then measured and the value reported using a 0-8 rating (0 = pale yellow through to 8 = dark green), where a score of 4 or lower indicates acceptable ripeness for selling. The results are shown in the bar chart.

Bar chart comparing the colour of bananas over days in storage for transgenic and control groups, with a six-colour key indicating different groups.

Describe the effect of transferring the bacterial gene on the suitability of the transgenic bananas for selling, compared to control bananas.

5d1 mark

Calculate how many days earlier the transgenic bananas reached a colour score of 4 (acceptable ripeness) compared with the control bananas.

5e2 marks

An important part of storage management is to delay the formation of brown or black spots on the skin of bananas. A second sample of bananas was harvested and stored. Bananas were removed from storage on day 8. They were then examined, and the number of brown or black spots present was recorded. The mean number of spots is indicated in the graph for control lines (C1, C2 and C3) and transgenic lines (T1, T2 and T3) of bananas.

Scatter plot showing number of brown or black spots on different banana varieties. Varieties C1-C3 and T1-T3 are on the x-axis, spots on the y-axis.

Determine how the bacterial gene affects the storage time of bananas.

6a1 mark

Artificial floating islands are man-made rafts or platforms that can be introduced to bodies of water to increase existing habitat for a variety of organisms, including invertebrates, amphibians and birds.

As artificial floating islands have been increasingly introduced to ponds and lakes in parks in London, UK, ecologists have studied the number of rafts available and how many of these are being used as nesting sites by birds. In particular, they have monitored the proportion of rafts used by common moorhens (Gallinula chloropus). Data was collected halfway through each year.

Line graph showing the number of available rafts, rafts used, and the proportion used by Gallinula chloropus from 2000 to 2018, with a sharp increase after 2010.

Estimate the number of rafts that were introduced to ponds and lakes between mid-2011 and mid-2012.

6b3 marks

Describe the data for the number of rafts available and the number of rafts being used.

6c2 marks

Foxes, badgers and cats are all known to predate on G. chloropus chicks. An ecologist conducted an investigation to see whether using ultrasonic repellers (usually used to deter and repel cats in domestic gardens) could reduce the numbers of these predators visiting a pond where G. chloropus were known to be nesting.

Bar chart showing visits to a pond by foxes, badgers, and cats with and without ultrasonic repellers. Visits decrease with repellers for all animals.

Contrast the number of visits to ponds with and without ultrasonic repellers for the three different predators.

6d1 mark

Suggest an explanation for the difference in visits to ponds with and without ultrasonic repellers seen in badgers.

6e4 marks

Over the same time period and for the same ponds and lakes in London that were studied in part (a), the ecologists monitored G. chloropus nests located on the banks of the ponds and lakes and on floating rafts in the centre of those ponds or lakes.

Many of the ponds and lakes had ultrasonic repellers placed on their banks over the study period. Every two years, the ecologists measured the average number of chicks that survived per nest.

Line graph showing chick survival rates from 2000 to 2016. Circles represent nests on banks or ponds, triangles for rafts. Both rates increase over time, rafts show higher survival rates.

A student looked at the graph and concluded that providing rafts was a more effective way of increasing chick survival than the use of ultrasonic repellers.

Evaluate the student's conclusion.

6f3 marks

Suggest how scientists could estimate the size of a local G. chloropus population.

7a1 mark

Helicoverpa punctigera (native budworm) is a species of moth that is a major pest of chickpea crops. Yield and seed quality decline when larval density reaches 10–20 per m2. Larvae are classified into four instars (sizes):

  • very small (VS): 1–2 mm

  • small (S): 4–7 mm

  • medium (M): 8–23 mm

  • large (L): 24–30+ mm

Farmers regularly monitor chickpea crops to decide the point at which insecticides are needed to control H. punctigera populations.

Bar chart showing percentage of feeding observations by instar size on C arietinum: small pod, large green pod, leaf, terminal, flowers, and stem.

Distinguish between the feeding preferences of larval instars that are <8 mm with instars that are >8 mm.

7b2 marks

Suggest why the feeding behaviour of H. punctigera shown in (a) causes a decline in chickpea yield.

7c1 mark

Pest management is economically and environmentally important to farmers.

To manage pests of chickpea crops, scientists assessed two approaches:

  • Genetically engineered chickpea plants expressing Bacillus thuringiensis (Bt), which produce a toxin lethal to herbivorous insects

  • The synthetic pyrethroid α-Cypermethrin, to which H. punctigera currently shows low resistance.

The graphs below represent data from the experiments undertaken.

Bar chart comparing mean larvae per metre under different pest control methods prior to pod development, showing no treatment has the highest mean.
Bar chart comparing mean larvae numbers per metre row for four pest control methods during pod development, differentiated by larvae size.

Identify the pest control management method that was most successful in controlling larvae that are <8 mm in length, prior to pod development.

7d4 marks

State the conclusions that can be drawn about the effectiveness of the pest management techniques when applied during pod development.

7e3 marks

A team of scientists seeking solutions for South Australian chickpea farmers proposed importing an egg-parasitoid wasp (Trichogramma pretiosum) that is native to the Americas. Female T. pretiosum lay their eggs inside moth eggs (including the eggs of H. punctigera). The wasp larva develops inside the moth egg, so the pest egg does not hatch and no caterpillar emerges.

Explain why introducing this biological control agent could cause problems for the local ecosystem.

7f2 marks

Australia’s wildlife is unusually distinctive and fragile, with many endemic species.

Outline why the researchers are very unlikely to be granted permission to release T. pretiosum in South Australia.

8a
Sme Calculator
1 mark

Grey seals (Halichoerus grypus) are large seals found in coastal waters around northern Europe and North America. Their diet consists of a variety of fish species, crustaceans and molluscs, and they are known to dive for periods of up to 45 minutes while searching for food. 

The graph shows blood flow to various organs in the body of a grey seal while they are searching for and actively chasing food at or near to the water’s surface (i.e. not during a dive).

Bar chart showing blood flow in cm³/min across heart, kidney, stomach, flipper muscles, and brain. Light grey bars indicate searching; dark grey, chasing prey.

Estimate the difference in blood flow to the heart when the seal is searching for food compared to when it is actively chasing prey.

8b2 marks

Compare and contrast the difference in blood flow when the seal is searching for food and when it is actively chasing prey between the kidneys, flipper muscles, and brain.

8c3 marks

Suggest why blood flow to the seal’s organs is different when the seal is searching for food compared to when it is actively chasing prey.

8d3 marks

Another grey seal’s heart rate was measured before, during, and after a feeding dive. The results are shown in the graph.

Graph showing heart rate changes over 16 minutes, with peaks at the start and end of a dive. Heart rate dips significantly during the dive.

Describe the changes in heart rate throughout the monitoring period.

8e3 marks

Suggest how the heart rate changes shown in the graph above might affect the seal’s body during a dive.

9a1 mark

Plant species living in dry climates need to preserve water and often have adaptations that helps them to do this. 

Scientists are interested in discovering crop varieties that have water-saving adaptations; one study looked at the effect of dry conditions on several varieties of wheat.

The researchers measured the water content of four varieties of wheat (V1, V2, V3, and V4) at the end of a 10-day period without water; their results are shown in the graph below.

Bar chart showing water content percentage in control and dry conditions across four variables (V1-V4). Asterisks for V1, V2 and V3 indicate statistical significance.

Calculate the difference in water content between the control and dry conditions for variety 2.

9b3 marks

Compare and contrast the effect of water availability on plant water content for the different varieties of wheat shown in part (a).

9c2 marks

The image below shows the effect of 10 days without water on the four varieties of wheat.

Diagram comparing plant growth under control and dry conditions across four variations, V1 to V4, with visibly less dense and more curled foliage in dry conditions.

Describe the effect of 10 days without water on wheat varieties 1-4

9d2 marks

Suggest why dry conditions caused the impacts seen in part (c).

9e2 marks

The scientists also analysed the potassium ion (K+) content of the tissues of each variety after the 10 day experiment period. The results of this analysis are shown in the graph below.

Bar chart comparing potassium ion content under control and dry conditions for V1-V4. Asterisks mark significant differences for v1-v3, p < 0.05.

Describe the impact of dry conditions on the potassium ion content of the different varieties.

9f3 marks

With reference to the results shown in parts (a), (c) and (e):

(i) deduce the effect of potassium ion content on the response of wheat to dry conditions

[1]

(ii) suggest how some wheat varieties are able to minimise the impact of dry conditions

[2]

9g3 marks

After reading the results shown in parts (a), (c) and (e), a farming organisation recommended that variety 4 should be planted by farmers in parts of the world where drought is common. 

Evaluate this recommendation.