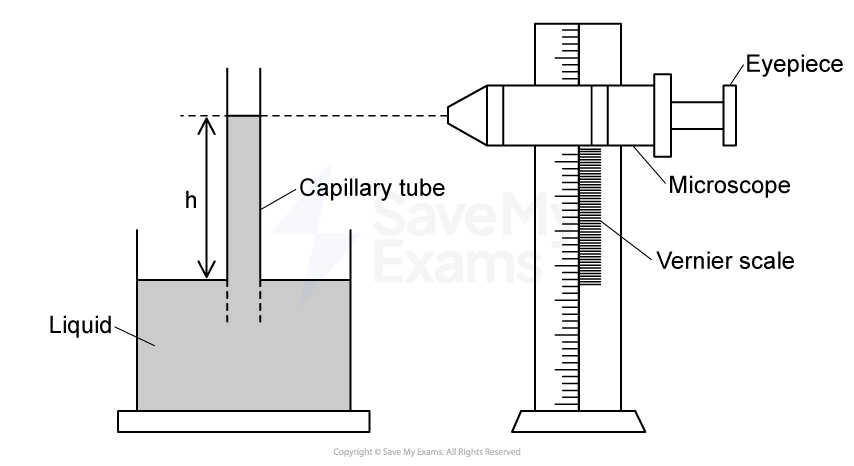
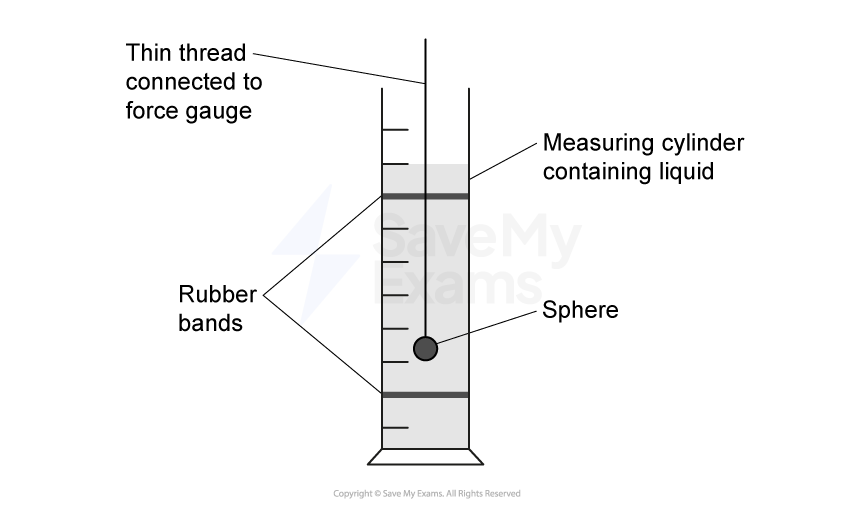
A group of students investigate the rise of a liquid in a capillary tube. The students use a travelling microscope to measure the height ![]() reached by the liquid when one end of the capillary tube is immersed into it.
reached by the liquid when one end of the capillary tube is immersed into it.
A travelling microscope is a measuring instrument consisting of a simple microscope that can be moved vertically along a vernier scale. The students take measurements of the positions of the top and bottom of the liquid column.
The students used a capillary tube with an internal radius r equal to 0.10 mm and recorded the following readings from the vernier scale.
Bottom of liquid column / cm | Top of liquid column / cm |
12.00 | 27.10 |
(i) State the uncertainty in each of these readings.
[1]
(ii) Calculate the percentage uncertainty in the student’s value of ![]() .
.
[2]
(iii) The students repeated the measurement of ![]() for capillary tubes of different radii. The table shows the student’s final data.
for capillary tubes of different radii. The table shows the student’s final data.
|
|
|
|---|---|---|
0.09 | 11.1 | 16.56 |
0.10 | 10.0 | 15.1 |
0.12 | 8.3 | 12.6 |
0.15 | 6.7 | 10.33 |
Discuss the values that the students have recorded.
[2]
The students suggest the following theoretical relationship between ![]() and
and ![]()
![]()
where ![]() is a constant.
is a constant.
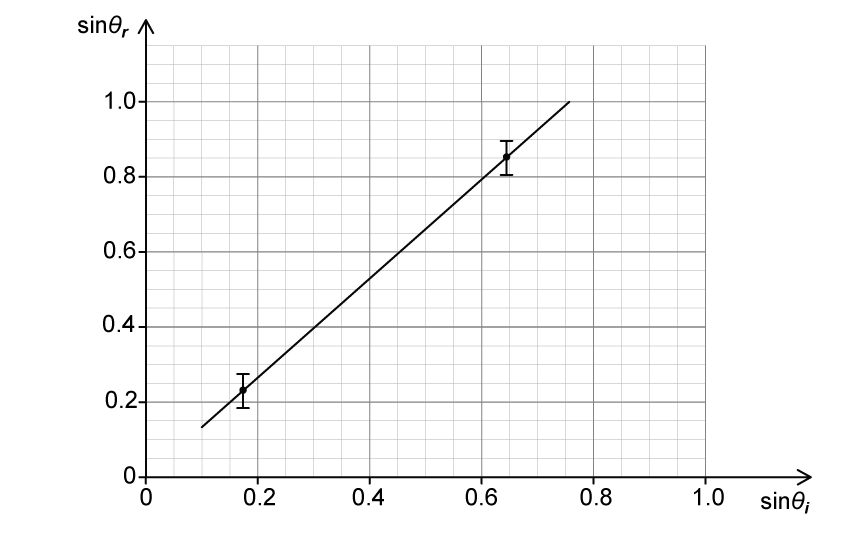
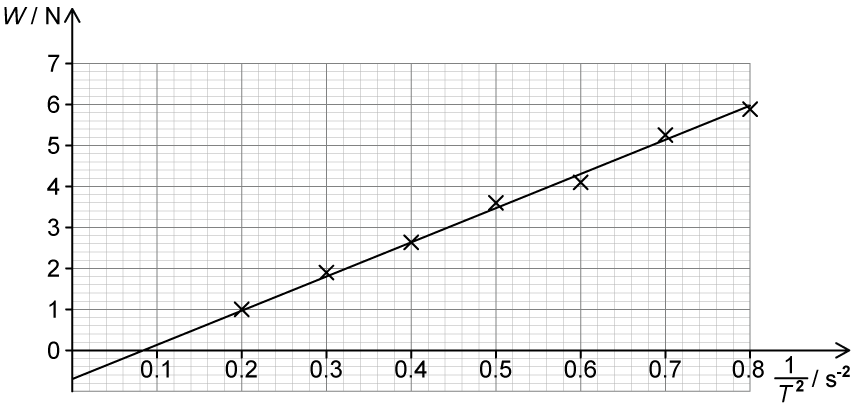
To verify the relationship, the variation of ![]() with
with ![]() is plotted.
is plotted.
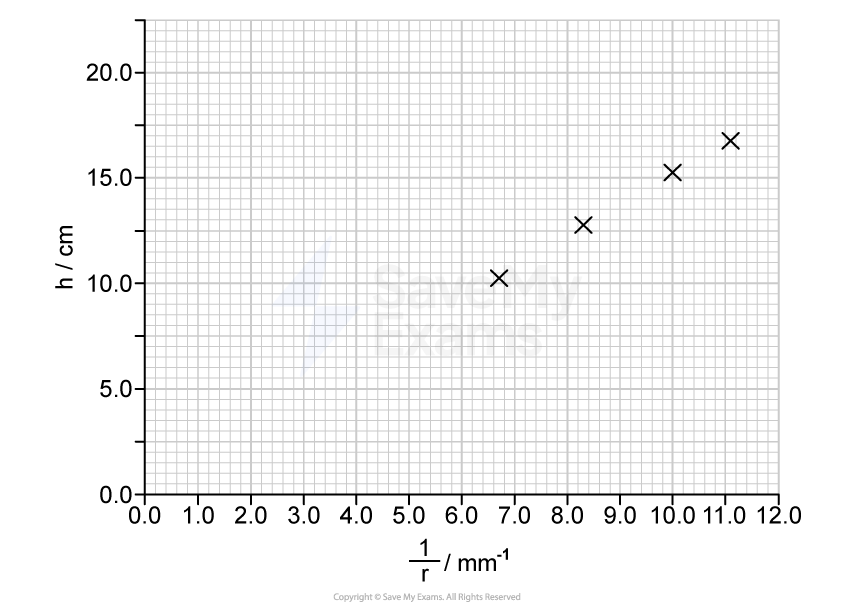
(i) Determine ![]() by drawing a line of best fit, and state an appropriate unit for
by drawing a line of best fit, and state an appropriate unit for ![]() .
.
[3]
(ii) Estimate ![]() for a tube with internal radius
for a tube with internal radius ![]() = 0.11 mm.
= 0.11 mm.
[1]
(iii) Suggest whether the student’s data supports the theoretical relationship.
[2]
Was this exam question helpful?


format('truetype')%3Bfont-weight%3Anormal%3Bfont-style%3Anormal%3B%7D%3C%2Fstyle%3E%3C%2Fdefs%3E%3Ctext%20font-family%3D%22Times%20New%20Roman%22%20font-size%3D%2218%22%20font-style%3D%22italic%22%20text-anchor%3D%22middle%22%20x%3D%225.5%22%20y%3D%2234%22%3ET%3C%2Ftext%3E%3Ctext%20font-family%3D%22math1da1748c56a8e6b097a67ee67c2%22%20font-size%3D%2216%22%20text-anchor%3D%22middle%22%20x%3D%2224.5%22%20y%3D%2234%22%3E%3D%3C%2Ftext%3E%3Ctext%20font-family%3D%22Times%20New%20Roman%22%20font-size%3D%2218%22%20text-anchor%3D%22middle%22%20x%3D%2241.5%22%20y%3D%2234%22%3E2%3C%2Ftext%3E%3Ctext%20font-family%3D%22math1da1748c56a8e6b097a67ee67c2%22%20font-size%3D%2216%22%20text-anchor%3D%22middle%22%20x%3D%2252.5%22%20y%3D%2234%22%3E%26%23x3C0%3B%3C%2Ftext%3E%3Cpolyline%20fill%3D%22none%22%20points%3D%2214%2C-45%2013%2C-45%206%2C0%202%2C-18%22%20stroke%3D%22%23000000%22%20stroke-linecap%3D%22square%22%20stroke-width%3D%221%22%20transform%3D%22translate(58.5%2C48.5)%22%2F%3E%3Cpolyline%20fill%3D%22none%22%20points%3D%226%2C0%202%2C-18%201%2C-16%22%20stroke%3D%22%23000000%22%20stroke-linecap%3D%22square%22%20stroke-width%3D%221%22%20transform%3D%22translate(58.5%2C48.5)%22%2F%3E%3Cline%20stroke%3D%22%23000000%22%20stroke-linecap%3D%22square%22%20stroke-width%3D%221%22%20x1%3D%2272.5%22%20x2%3D%2295.5%22%20y1%3D%223.5%22%20y2%3D%223.5%22%2F%3E%3Cline%20stroke%3D%22%23000000%22%20stroke-linecap%3D%22square%22%20stroke-width%3D%221%22%20x1%3D%2276.5%22%20x2%3D%2291.5%22%20y1%3D%2227.5%22%20y2%3D%2227.5%22%2F%3E%3Ctext%20font-family%3D%22Times%20New%20Roman%22%20font-size%3D%2218%22%20font-style%3D%22italic%22%20text-anchor%3D%22middle%22%20x%3D%2283.5%22%20y%3D%2220%22%3EL%3C%2Ftext%3E%3Ctext%20font-family%3D%22Times%20New%20Roman%22%20font-size%3D%2218%22%20font-style%3D%22italic%22%20text-anchor%3D%22middle%22%20x%3D%2283.5%22%20y%3D%2245%22%3Eg%3C%2Ftext%3E%3C%2Fsvg%3E)