Data-Based Questions (Paper 1B) (DP IB Physics: HL): Exam Questions

3 hours20 questions
1a
Sme Calculator
2 marks

A group of students investigate the motion of a simple pendulum to determine a value for the acceleration of free fall g.

ib-practice-paper-1b-set-a-question-2a

The group measures the length l of the pendulum with a metre rule and obtains the following repeated readings.

l space divided by space cm

l subscript 1

l subscript 2

l subscript 3

l subscript 4

85.5

86.0

87.5

85.5

The group divides into two subgroups, A and B, to analyse the data.

Group A quotes the mean value of l as 86.125 cm.

Group B quotes the mean value of l as 85.7 cm.

Discuss the values that the groups have quoted.

1b2 marks

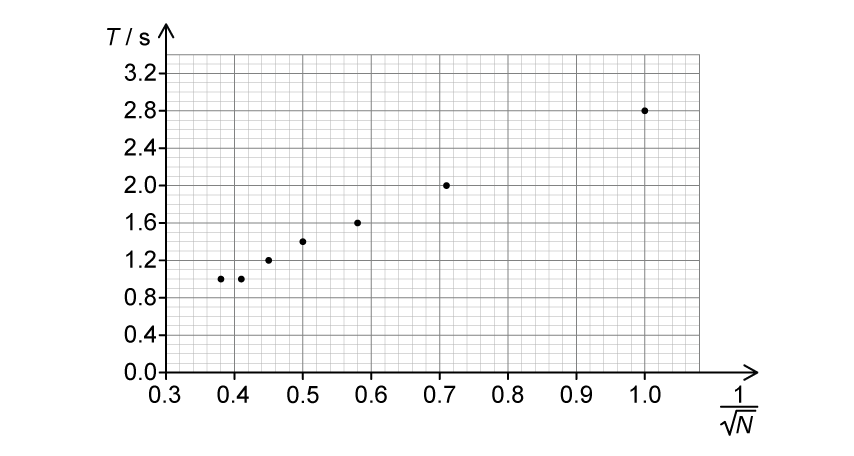
Theory predicts that

g space proportional to space l to the power of x T to the power of y

Calculate x and y.

1c
Sme Calculator
4 marks

The group sets the pendulum into oscillations with small amplitude and uses a stopwatch to determine the time period.

q5b-june-2018-9ph0-03-edexcel-as-a-level-phy

The stopwatch is started when the pendulum is released at A. Measurements of the time period are taken over 5 oscillations and divided by 5. The procedure is repeated twice and the mean period is determined to be T space equals space 1.86 space plus-or-minus space 0.02 space straight s.

(i) Calculate their value of g and the percentage uncertainty in this value.

[3]

(ii) Suggest a modification to the method that could reduce the uncertainty in their value of T.

[1]

2a2 marks

A group of students investigate the Beaufort scale for describing wind intensity. On this scale, the average wind speed v increases with the Beaufort scale value B, according to the relationship:

v space equals space k B to the power of p

where k andspace p are constants.

Explain why a graph of log space v against log space B should give a straight line.

2b
Sme Calculator
8 marks

The table shows the data recorded by the students for values of v and corresponding values of B.

v space divided by space straight m space straight s to the power of negative 1 end exponent

B


2.00

1


10.0

3


21.5

5


36.0

7


50.5

9


68.0

11


(i) Plot a graph of log space v against log space B on the grid below.

Use the columns provided to show any processed data.

[5]

ib-practice-paper-1b-set-b-question-2b

(ii) Use your graph to determine the values ofspace p and k.

[3]

3a2 marks

A student investigates the behaviour of a thermistor using the circuit shown in the diagram.

ib-practice-paper-1b-set-c-question-2a

The student heated the thermistor to 100°C and measured the potential difference V across it. They decreased the temperature theta and recorded further measurements of V and theta until the temperature reached 10°C.

Suggest a suitable method for varying the temperature of the thermistor.

3b
Sme Calculator
2 marks

The reading of V when the thermistor was at room temperature is shown on the voltmeter in the diagram below.

ib-practice-paper-1b-set-c-question-2b

Calculate the percentage uncertainty in the measured value of V.

3c2 marks

The student plotted a graph of the measurements of V and θ.

ib-practice-paper-1b-set-c-question-2c

Estimate the value of V for a temperature of 0°C.

3d
Sme Calculator
2 marks

The student proposes the hypothesis that V is inversely proportional to the absolute temperature theta in Kelvin.

Deduce, using two suitable data points from the graph, whether the student's hypothesis is supported.

4a3 marks

A group of students investigate how the period T of oscillation of a mass-spring system varies with the number N of vertical springs.

The students attach a mass m to a vertical spring which is fixed at its upper end. The mass is displaced by a small vertical distance and then released. The time T for one oscillation is measured for N identical springs attached in parallel.

Two diagrams show springs hanging from a fixed support. Left: one spring, mass m. Right: two parallel springs, same mass m.

The table shows some of the data collected by the students.

N

T / s ± 0.1 s

1

2.8

3

1.6

5

1.2

(i) m is provided by two identical slotted masses, each of known mass, with an uncertainty of 0.001 kg.

State the uncertainty in the total mass m.

[1]

(ii) T is measured with an electronic stopwatch that measures to the nearest 0.1 s.

Describe how an uncertainty in T of less than 0.1 s can be achieved using this stopwatch.

[2]

4b
Sme Calculator
3 marks

The graph shows the variation of T with N. The uncertainty in N is negligibly small.

Scatter plot graph showing T in seconds versus N, with data points decreasing diagonally from top left to bottom right, vertical error bars included.

(i) Outline why it is unlikely that the relationship between T and N is linear.

[1]

(ii) Calculate the largest fractional uncertainty in T for these data.

[2]

4c
Sme Calculator
6 marks

The students suggest the following theoretical relationship between T and N:

T space equals space fraction numerator A over denominator square root of N end fraction

where A is a constant.

To verify the relationship, the variation of T with fraction numerator 1 over denominator square root of N end fraction is plotted.

Scatter plot graph showing a positive correlation between T in seconds on the y-axis and 1 over the square root of N on the x-axis, with seven data points.

(i) Determine A by drawing the line of best fit.

[3]

(ii) State the units of A.

[1]

(iii) The theoretical relationship assumes that the springs behave as ideal springs following Hooke's law.

Suggest why, in order to test the relationship, the amplitude of oscillation should be kept small compared to the natural length of the springs.

[2]

5a1 mark

A student is analysing a sample of sunflower oil. To determine its density, the student measures the volume with a measuring cylinder and the mass with an electronic balance.

Identify one way to ensure that the volume is read accurately.

5b
Sme Calculator
3 marks

The following data are collected:

  • Volume = (15.0 ± 0.2) cm3

  • Mass = (13.77 ± 0.01) g

(i) Calculate the density of the sample and its absolute uncertainty.

[2]

(ii) State your answers in kg m-3 and with correct precision.

[1]

5c2 marks

When the density was measured, the sample was at 25 °C. The student has a graph that shows the variation with temperature of the density of pure sunflower oil.

Graph showing the density of pure water in kilograms per metre cubed decreasing linearly as the temperature in degrees Celsius rises, ranging from around 930 at 0°C to below 900 at 50°C.

Suggest whether the oil sample can be considered pure.

6a1 mark

A student determines the density rho of a solid metal cylinder.

The student makes the following measurements:

Length L of the cylinder = (27.3 ± 0.2) mm

Readings for the diameter d of the cylinder:

Reading

1

2

3

4

5

6

d / mm

12.8

12.2

12.3

11.9

12.6

12.5

Mass m of the cylinder = 29.8 g ± 1.5 %

Outline why the measurements of d were made at different places along the cylinder.

6b2 marks

Suggest suitable instruments for the measurement of

(i) L

[1]

(ii) d

[1]

6c
Sme Calculator
5 marks

(i) Show that the mean diameter of the cylinder is about 12.5 mm.

[2]

(ii) Calculate the fractional uncertainty in the diameter of the cylinder.

[2]

(iii) Calculate the fractional uncertainty in the length of the cylinder.

[1]

6d
Sme Calculator
3 marks

The density of the cylinder is given by

rho space equals space fraction numerator m over denominator A L end fraction

where A is the cross-sectional area of the cylinder.

Calculate the value of rho and its absolute uncertainty. State your answers to an appropriate number of significant figures.

7a2 marks

A student investigates the electromotive force (emf) epsilon and internal resistance r of a cell.

They do this by measuring the terminal potential difference V and current I in the circuit shown.

Electrical circuit diagram with a cell with internal resistance r, an ammeter connected in series and a voltmeter connected in parallel, and a variable resistor.

A graph of the variation of V with I is plotted. The uncertainty in I is negligible.

Graph showing voltage (V) versus current (I) with data points descending from around 1.45V at 0.1A to 1.2V at 0.6A, marked with error bars.

Draw, on the graph, the lines of maximum and minimum gradient.

7b
Sme Calculator
5 marks

(i) Determine, using the graph, the emf of the cell, including its absolute uncertainty. Give your answers to an appropriate number of significant figures.

[3]

(ii) Outline how the internal resistance can be determined from this graph.

[2]

7c2 marks

The student adds a second identical cell in series with the first cell and repeats the experiment.

Describe the key features of the graph for this second experiment compared to the first.

8a3 marks

In an experiment to measure the specific latent heat of vaporisation of water, a student uses an electric heater to boil water. When the water is boiling steadily, they use an electronic balance to measure the mass m of water that vaporises in time t = 240 s.

The theoretical relationship is given by

L subscript v space equals space fraction numerator V I t over denominator m end fraction

where V is the potential difference across the heater and I is the current in it.

(i) V is provided by two identical power supplies connected in series. The potential difference of each of the power supplies is known with an uncertainty of 0.2 V.

State the uncertainty in the potential difference V.

[1]

(ii) Draw a suitable circuit diagram that would enable L subscript v to be determined. The symbol for a heater is shown.

[2]

Circuit symbol for a heater
8b
Sme Calculator
4 marks

The student repeated the experiment for different powers supplied to the heater. They plot a graph of the power P of the heater against the mass m of water vaporised in 240 seconds.

Scatter plot with mass in grams on the x-axis and power P in watts on the y-axis showing five data points.

(i) Outline how the student obtained different values of P.

[2]

(ii) The percentage uncertainty in m is ±5 %.

Calculate the absolute uncertainty in m when P = 100 W and draw the uncertainty bar for this data point on the graph.

[2]

8c
Sme Calculator
5 marks

(i) Determine L subscript v by drawing the line of best fit.

[4]

(ii) State the units of L subscript v.

[1]

8d2 marks

Outline one source of systematic error in the experiment and its effect on the calculated value of the specific latent heat of vaporisation of water.

9a2 marks

A student uses Young’s double-slit apparatus to determine the wavelength lambda of monochromatic light using the relation

lambda space equals space fraction numerator s d over denominator D end fraction

where s is the separation of the fringes, d is the separation of the slits, and D is the distance from the slits to the screen.

A double-slit experiment with monochromatic light of wavelength lambda creating an interference pattern on a screen distance D away from the slits, with slit separation d and fringe spacing s indicated.

s is measured using a ruler with a smallest scale division of 1 mm.

Describe how an uncertainty in s of less than 1 mm can be achieved using this ruler.

9b2 marks

Discuss the effect on the fractional uncertainty in s when using a larger value of D.

9c
Sme Calculator
3 marks

(i) To determine lambda, the student plots a graph with s on the vertical axis.

State the variable that must be plotted on the horizontal axis to obtain a line of best fit that is straight.

[1]

(ii) The calculator value obtained from the graph gives lambda = 630.102 nm with a percentage uncertainty of ±8 %.

Deduce how this value of lambda should be recorded in a conclusion, including the absolute uncertainty, to the appropriate number of significant digits.

[2]

10a
Sme Calculator
4 marks

A student conducts an experiment to determine the speed of sound in air using standing waves in a tube.

The student holds a tuning fork of known frequency at the open end of the plastic tube, which is partially submerged in a measuring cylinder of water. The student slowly lowers the tube into the water and measures the length L of the air column when the first loud sound is heard.

A tuning fork above a plastic tube in a measuring cylinder of water, with L labelled between the surface of the water and the top of the tube.

The experiment is repeated several times for the same tuning fork. The student obtains the following repeated readings of L.

Reading

1

2

3

4

5

L / cm

18.4

18.0

18.9

19.4

19.2

(i) Calculate the mean value of L and its percentage uncertainty.

[3]

(ii) Suggest one reason for the variation in the measured value of L.

[1]

10b
Sme Calculator
3 marks

The procedure is repeated using tuning forks of different values of frequency f.

The student plots a graph of the variation of f with 1 over L. They add an uncertainty bar for 1 over L for the first data point and draw the best-fit line.

Graph showing a linear relationship between frequency f in Hertz and 1 over the length in metres with 6 data points, a line of best fit, and one error bar at f = 256 Hz.

(i) Suggest why the student has not drawn uncertainty bars for f.

[1]

(ii) For the value of L calculated in (a)(i), draw the uncertainty bar on the graph for this data point only.

[2]

10c
Sme Calculator
5 marks

(i) Determine the gradient of the student's best-fit line.

[2]

(ii) Draw on the student's graph the line of maximum gradient.

[1]

(iii) Determine the value of the speed of sound with its absolute uncertainty.

[2]