Syllabus Edition
First teaching 2025
First exams 2027
Motivation: Quitting Smoking (DP IB Psychology): Revision Note

Motivation: quitting smoking
Worked Example
Here is an example of a Paper 3 source and a 6-mark SAQ using motivation (HL extension) in the Health & Wellbeing context:
Source 2:
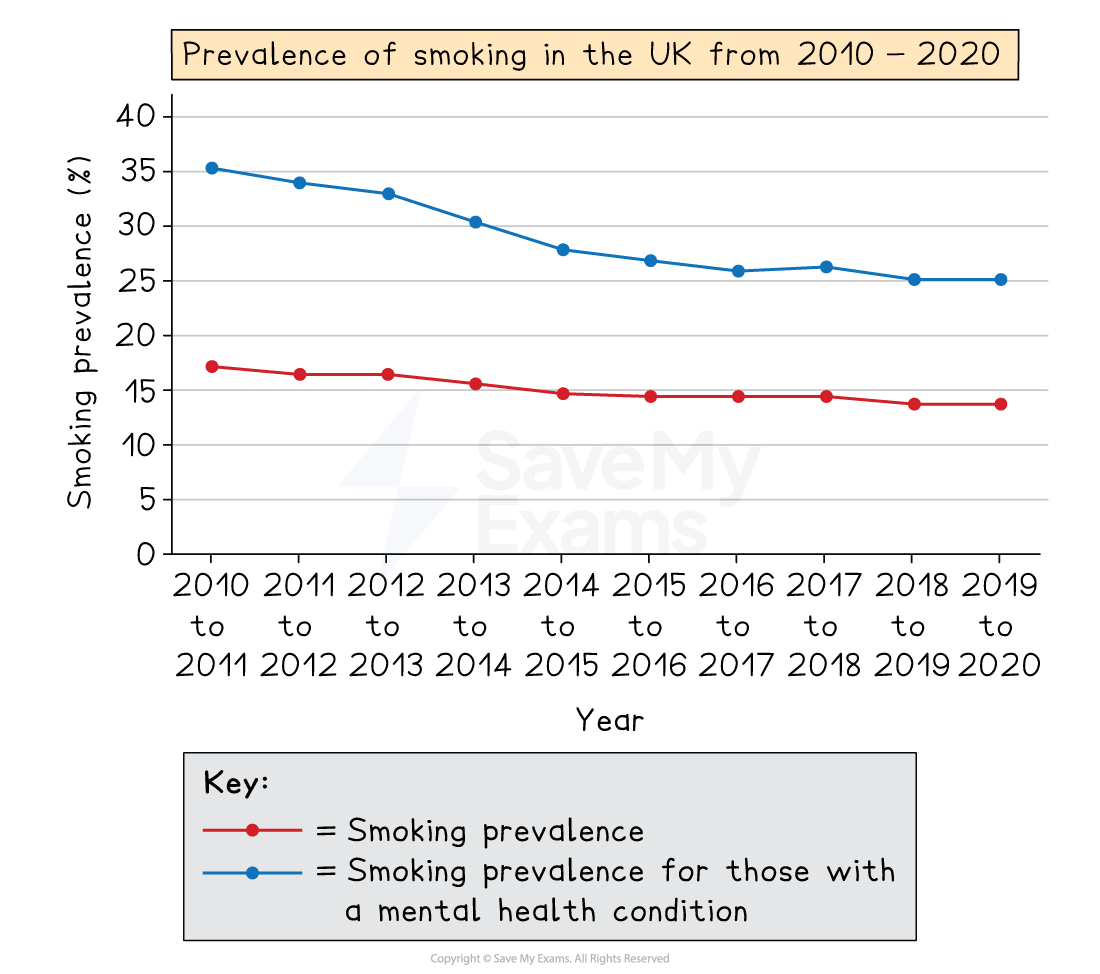
Q2: Analyse the findings from source 2 and state a conclusion linked to the claim that awareness of decreasing prevalence rates for smoking should act as motivation to quit smoking.
[6 marks]
Model answer:
The line graph shows that smoking prevalence decreased in both the general population and for the population of those with a mental health condition from 2010 to 2020. This suggests that smoking is becoming less popular over time, possibly due to increased awareness of its harmful effects or because of other factors (e.g., lack of places to smoke in public, peer influence).
These findings could act as motivation to quit smoking, as they could provide encouragement for the smoker, i.e., other people have managed to quit. Alternatively, the smoker may feel that by smoking they are not conforming to a general social norm which is not to smoke. This could work as motivation to quit smoking, as by not smoking they are adhering to the majority group norm.
Guidance:
Your analysis should refer to the raw scores (if these are included) and/or the descriptive/inferential statistics presented in the findings
For descriptive stats this may comprise the mean/median/mode as measures of central tendency and the range/standard deviation as measures of dispersion
For inferential stats this may comprise a statement of significance and/or link to the level of probability used
You should always state which condition of the IV performed better
You should comment on what the stats seem to suggest about performance per condition
If relevant, you should comment on what the data tells you about the population, e.g., is this a normal distribution or is it skewed?
If the research is qualitative then you should focus on how the findings have been categorised/presented and whether there are drawbacks or limitations to how it has been gathered (e.g., sample size, potential bias)
You should draw a conclusion based on what the data in the source/study tells you about what is being investigated
E.g., do the findings suggest that X does affect Y?

Unlock more, it's free!
Join the 100,000+ Students that ❤️ Save My Exams
the (exam) results speak for themselves:

Was this revision note helpful?
