1
3 marks
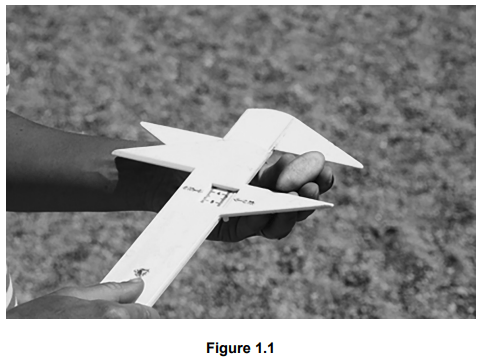
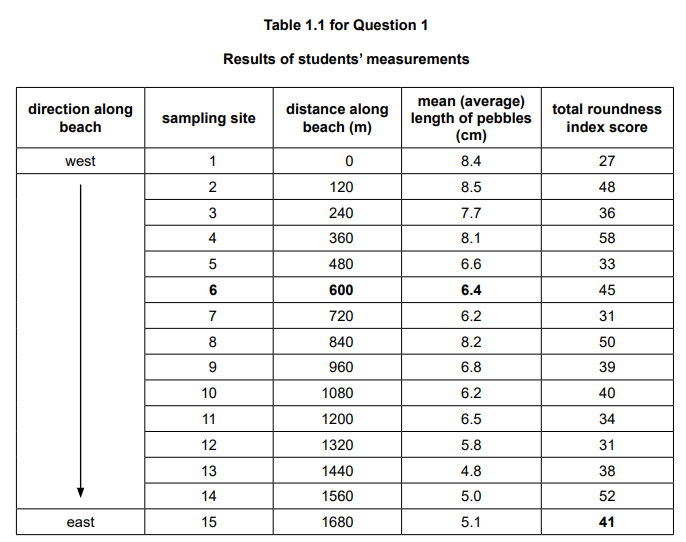
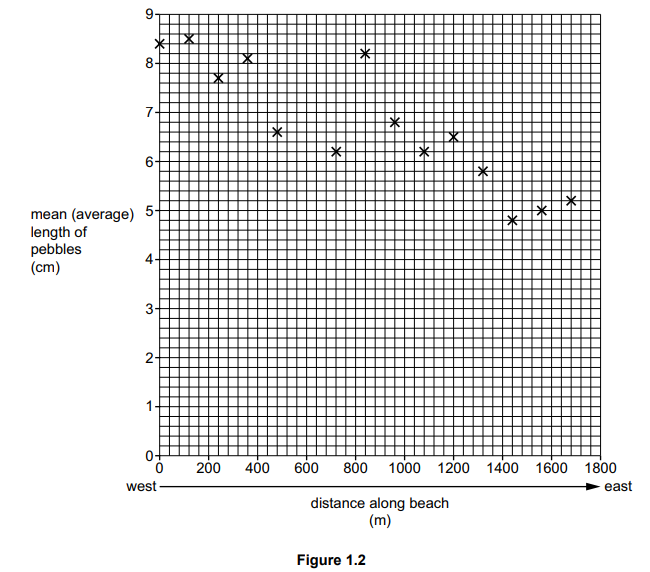
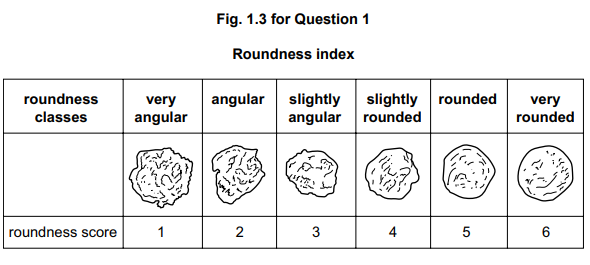
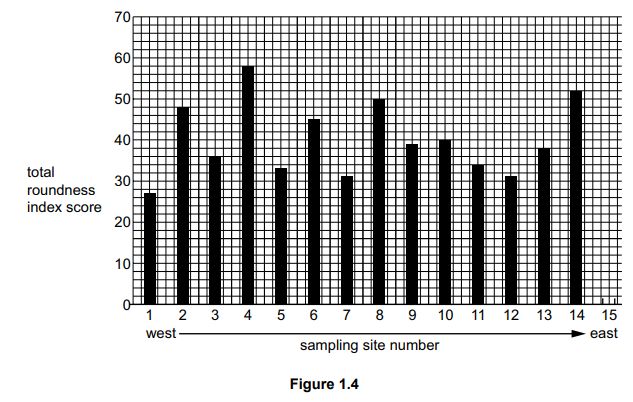
Two students did fieldwork on a local coastline where there is a pebble beach in a bay. The students investigated the effect of pebbles being moved along the beach from west to east.
The students had learned that pebbles are moved along the beach by longshore drift.
Which of the following statements are true about longshore drift?
Tick three answers.
Movement of material up and down the beach is repeated with each wave.
The direction of longshore drift depends on the direction of the tide.
Backwash moves material up the beach.
The prevailing wind influences the direction of longshore drift movement.
Swash moves material down the beach.
Longshore drift occurs in deep water.
Waves approach the coastline at an angle.
Was this exam question helpful?