Representing Waves on Graphs (Edexcel International AS Physics): Revision Note
Exam code: XPH11

Written by: Lindsay Gilmour
Updated on
Graphs of Transverse & Longitudinal Waves
Representing transverse waves
Transverse waves are commonly represented using:
displacement-distance graphs
displacement-time graphs
On the displacement-distance graph:
amplitude
 is measured from the rest position to the point of maximum displacement
wavelength
 is measured from one point on a wave to the same point on the next wave (e.g. two consecutive crests or troughs)
On the displacement-time graph:
period
 is measured from one point on a wave to the same point on the next wave
frequency can be calculated using
format('truetype')%3Bfont-weight%3Anormal%3Bfont-style%3Anormal%3B%7D%3C%2Fstyle%3E%3C%2Fdefs%3E%3Ctext%20font-family%3D%22Times%20New%20Roman%22%20font-size%3D%2218%22%20font-style%3D%22italic%22%20text-anchor%3D%22middle%22%20x%3D%227.5%22%20y%3D%2230%22%3Ef%3C%2Ftext%3E%3Ctext%20font-family%3D%22math17f39f8317fbdb1988ef4c628eb%22%20font-size%3D%2216%22%20text-anchor%3D%22middle%22%20x%3D%2225.5%22%20y%3D%2230%22%3E%3D%3C%2Ftext%3E%3Cline%20stroke%3D%22%23000000%22%20stroke-linecap%3D%22square%22%20stroke-width%3D%221%22%20x1%3D%2240.5%22%20x2%3D%2255.5%22%20y1%3D%2223.5%22%20y2%3D%2223.5%22%2F%3E%3Ctext%20font-family%3D%22Times%20New%20Roman%22%20font-size%3D%2218%22%20text-anchor%3D%22middle%22%20x%3D%2248.5%22%20y%3D%2216%22%3E1%3C%2Ftext%3E%3Ctext%20font-family%3D%22Times%20New%20Roman%22%20font-size%3D%2218%22%20font-style%3D%22italic%22%20text-anchor%3D%22middle%22%20x%3D%2247.5%22%20y%3D%2241%22%3ET%3C%2Ftext%3E%3C%2Fsvg%3E)

Transverse waves can be graphed to visualise the perpendicular vibrations over distance or time
To determine the next position of a point on the wave
Sketch the full wave after time has passed by looking at the direction of travel
Each point oscillates perpendicular to the wave, so it remains on the normal line wherever the wave intersects, as shown in red below

Representing longitudinal waves
Longitudinal waves can be represented using:
displacement-distance graphs
pressure-distance graphs
On the displacement-distance graph:
the amplitude and wavelength can be measured in the same way as the transverse wave
zero displacement occurs at compressions and rarefactions
maximum displacement occurs halfway between compressions and rarefactions
The pressure-distance graph is:
highest at compressions and lowest at rarefactions
90° out of phase with the displacement graph
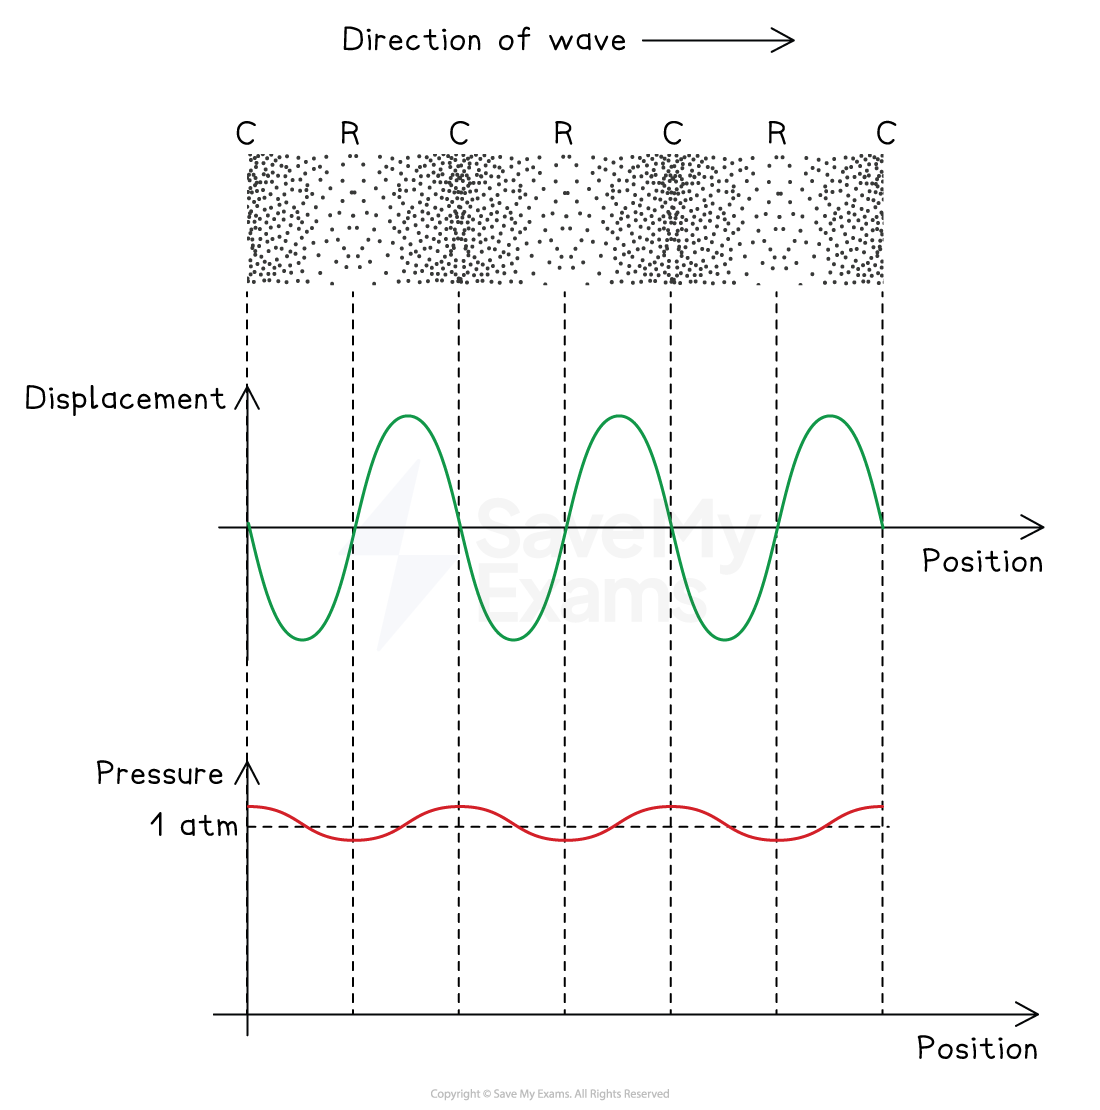
Longitudinal waves can be graphed to visualise the displacement of particles at different positions, as well as the pressure at each position
A sound wave is a longitudinal wave caused by oscillations of particles in the medium, e.g. air molecules
At a compression:
air molecules have zero displacement (compared to their equilibrium positions)
air molecules on either side are displaced towards it
this creates an area of high pressure
At a rarefaction:
air molecules have zero displacement (compared to their equilibrium positions)
air molecules on either side are displaced away from it
this creates an area of low pressure
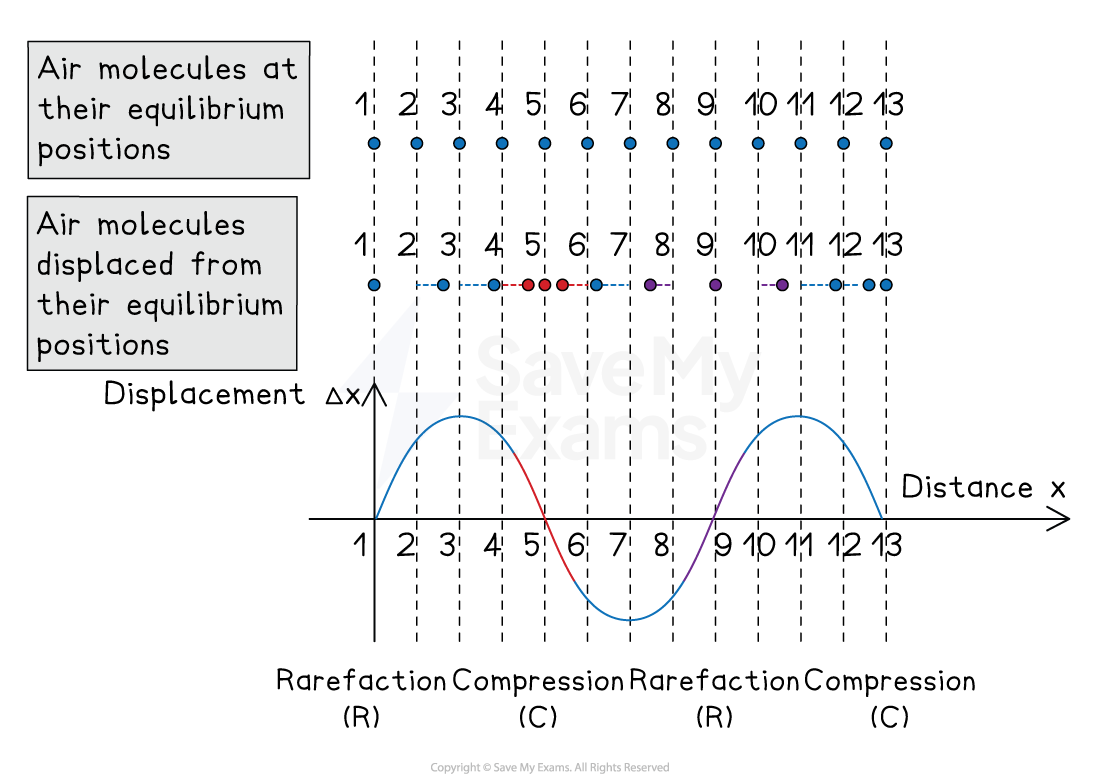
The positions of air molecules in a sound wave can be mapped onto a displacement-distance graph
Worked Example
The graph shows how the displacement of a particle in a wave varies with time.
Which statement is correct?
A. The wave has an amplitude of 2 cm and could be either transverse or longitudinal.
B. The wave has an amplitude of 2 cm and has a time period of 6 s.
C. The wave has an amplitude of 4 cm and has a time period of 4 s.
D. The wave has an amplitude of 4 cm and must be transverse.
Answer: A

Graphs of Stationary Waves
Stationary waves occur when a wave is reflected with a 180o phase difference, creating a wave with a series of nodes and antinodes
Stationary waves can be transverse or longitudinal
They are represented graphically in the same way as progressive (travelling) waves
Graphs of standing waves can also be used to determine the position of nodes and antinodes
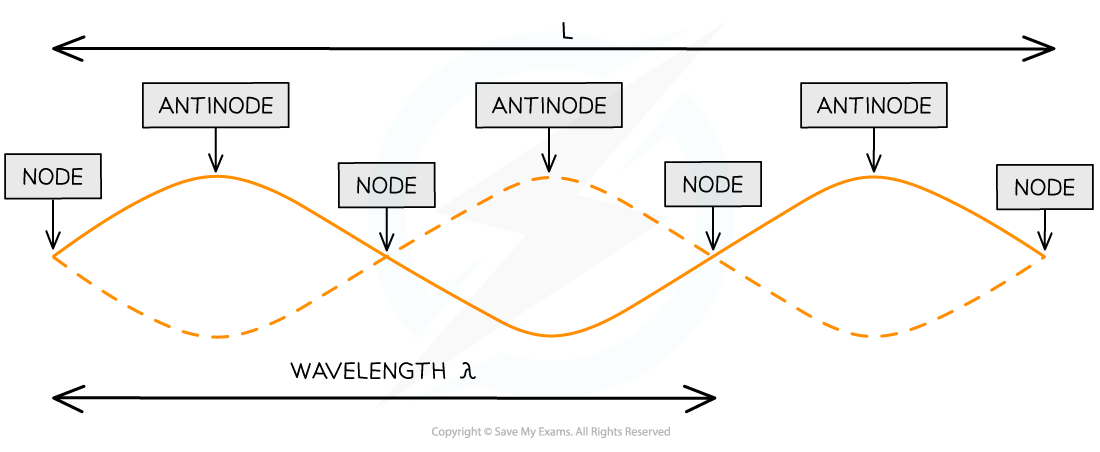
L is the length of the string
1 wavelength λ is only a portion of the length of the string
Examiner Tips and Tricks
Both transverse and longitudinal waves can look like transverse waves when plotted on a graph - make sure you read the question and look for whether the wave travels parallel (longitudinal) or perpendicular (transverse) to the direction of travel to confirm which type of wave it is.

Unlock more, it's free!
Join the 100,000+ Students that ❤️ Save My Exams
the (exam) results speak for themselves:

Was this revision note helpful?