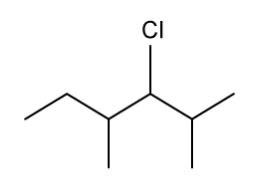
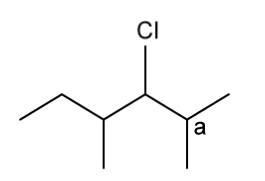
1a
2 marks
Identify which of the following compounds are hydrocarbons. Explain your choice.
Butane (C4H10)
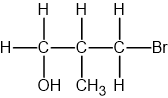
Butan-1-ol (C4H9OH)
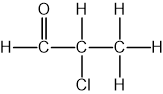
Chlorobutane (C4H9Cl)
1b
2 marks
State the general formula for the following hydrocarbon families:
Alkanes …………………………
Alkenes …………………………
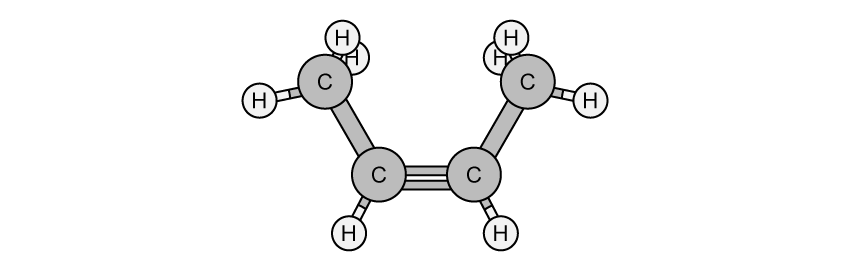
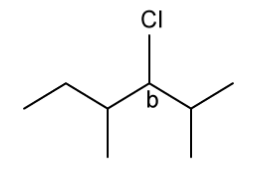
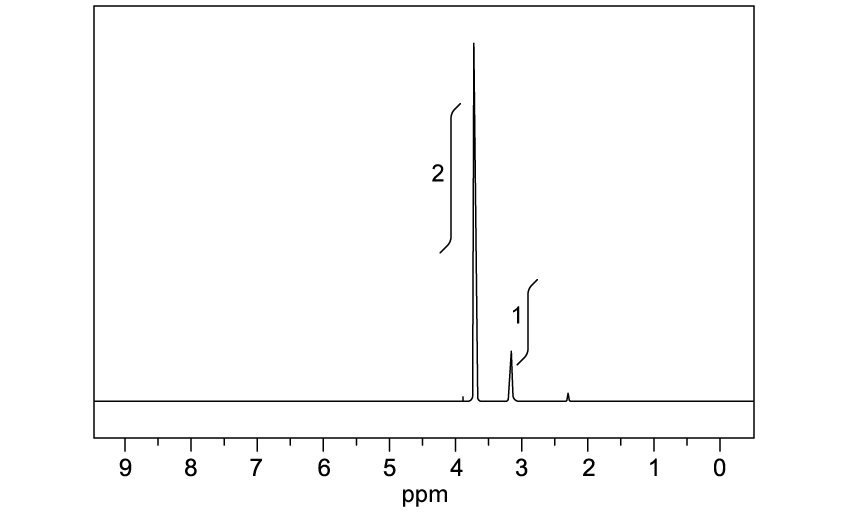
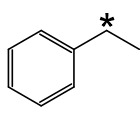
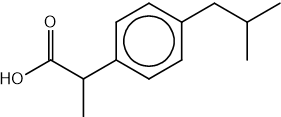
1c
1 mark
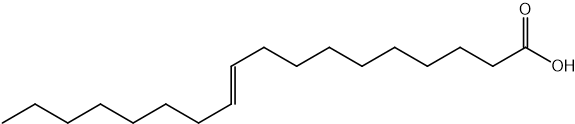
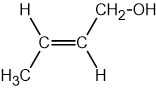
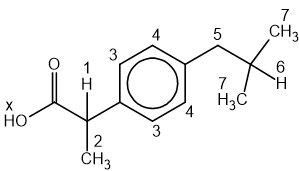
State the IUPAC name of the following hydrocarbon.

1d
3 marks
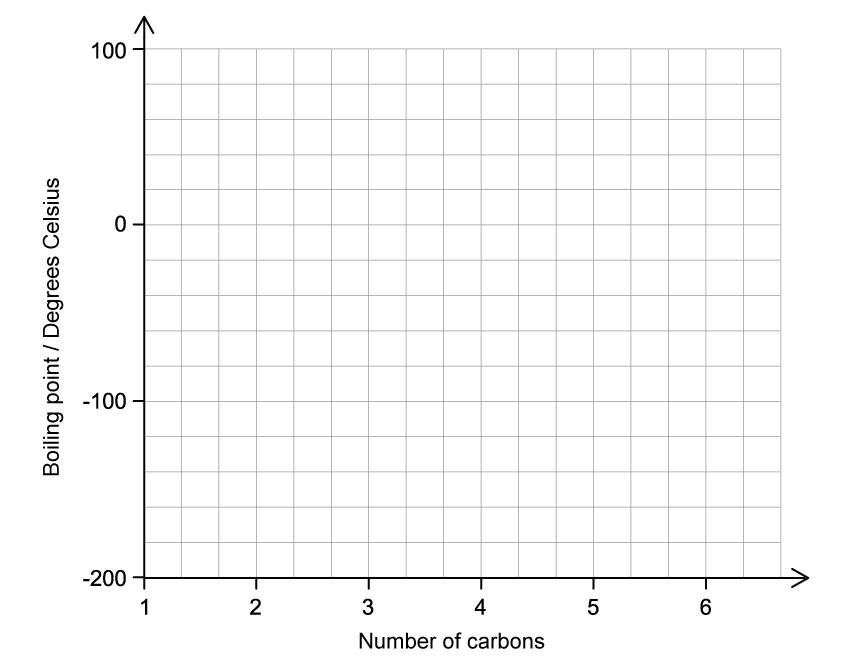
A student stated that as the number of carbon atoms increases in an alkane, the boiling point increases. State if the student is correct and justify your answer.
Was this exam question helpful?