Data-Based Questions (Paper 1B) (DP IB Chemistry: HL): Exam Questions

4 hours18 questions
1a
2 marks

A student investigated the enthalpy change of neutralisation by gradually adding aqueous potassium hydroxide (KOH) to a known volume of aqueous ethanoic acid (CH3COOH) in a polystyrene cup. A temperature probe recorded the temperature after each addition.

The following data were obtained:

Volume of KOH added (±0.1 cm3)

0.0

5.0

10.0

15.0

20.0

25.0

30.0

35.0

Temperature (±0.1 °C)

22.5

24.7

26.5

27.8

28.6

28.9

28.7

28.4

(i) Describe the overall trend in the temperature as the volume of KOH increases.

[1]

(ii) Suggest a reason for the slight decrease in temperature after 25.0 cm3 of KOH have been added.

[1]

1b
1 mark

A graph of temperature against volume of KOH added was plotted.

Graph showing temperature change from 22°C to 29°C as the volume of KOH increases from 0 to 35 cm³. Temperature initially rises, then stabilises.

Estimate the volume of KOH added at which neutralisation is complete, based on the data.

1c
1 mark

The concentration of the ethanoic acid was 1.00 mol dm-3, and the volume used was 25.0 cm3.

Determine the number of moles of ethanoic acid in the cup before titration began.

1d
3 marks

The student forgot to record the concentration of the KOH solution.

Describe how the temperature data and the enthalpy change of neutralisation (ΔHneut = –57.0 kJ mol-1) can be used to determine the concentration of the KOH solution.

1e
2 marks

Identify one assumption made in the method described in (d), and explain how it could affect the final value obtained.

1f
2 marks

Suggest two improvements to the experimental method to reduce heat loss to the surroundings.

2a
2 marks

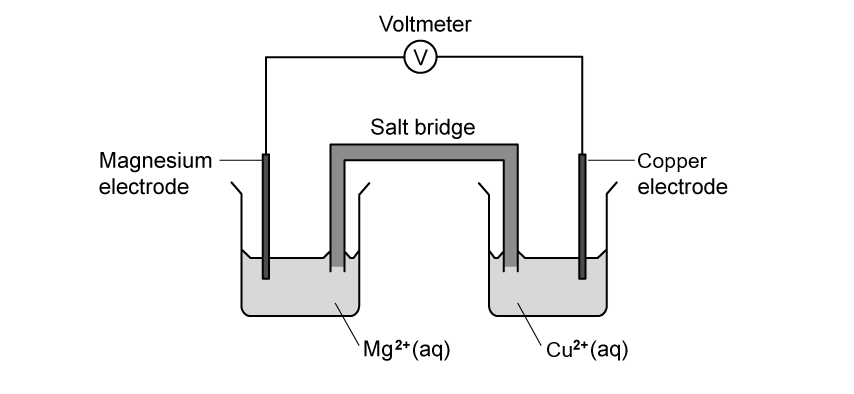
A student investigated how the distance between two electrodes affects the current in a voltaic cell. She used a magnesium electrode in a solution of magnesium nitrate and a copper electrode in a solution of copper(II) nitrate, connected by a salt bridge containing aqueous potassium nitrate (KNO3).

The experiment was repeated with two different concentrations of KNO3: 0.50 mol dm-3 and 1.00 mol dm-3. For each trial, the student increased the distance between the electrodes from 2.0 cm to 10.0 cm and recorded the current.

A diagram of the setup is shown below.

Diagram of an electrochemical cell with a magnesium electrode, copper electrode, voltmeter, and salt bridge, in Mg²⁺ and Cu²⁺ solutions respectively.

Identify the direction of electron flow in the external circuit and explain your answer.

2b
2 marks

i) Write the half-equation for the reaction occurring at the magnesium electrode.

[1]

ii) Explain whether the magnesium electrode acts as the anode or cathode.

[1]

2c
2 marks

Explain why the current is higher in the 1.00 mol dm-3 KNO3 solution than in the 0.50 mol dm-3 solution.

2d
3 marks

The student's results are shown in the graph below.

Graph showing current vs. distance between electrodes for 0.50 and 1.00 mol dm⁻³ KNO₃ solutions. Current decreases as distance increases.

i) Use the graph to estimate the current for the 1.00 mol dm-3 solution when the electrodes are 6.0 cm apart.

[1]

ii) Calculate the percentage increase in current at 4.0 cm when using the 1.00 mol dm⁻³ solution instead of the 0.50 mol dm-3 solution.

[2]

2e
2 marks

Explain the shape of the graph using ideas about ion movement and solution resistance.

2f
3 marks

The student considered replacing the Mg and Cu electrodes with platinum.

i) Explain whether this change would improve the reliability of the results.

[2]

ii) Suggest one controlled variable (other than distance, electrode material, and concentration) that should remain the same in each trial.

[1]

3a
2 marks

A student investigates the buffering effect of different concentrations of a weak acid and its conjugate base. The acid used is ethanoic acid (CH3COOH), and the conjugate base is sodium ethanoate (CH3COONa).

The student prepares three buffer solutions, each with a total concentration of 0.200 mol dm-3, but with varying ratios of acid to conjugate base. The pKa of ethanoic acid is 4.76.

Buffer

[CH3COOH] / mol dm-3

[CH3COO⁻] / mol dm-3

A

0.150

0.050

B

0.100

0.100

C

0.050

0.150

The pH of a buffer can be calculated using the Henderson-Hasselbalch equation:

pH = pKa + log[conjugate base][weak acid]

Calculate the pH of buffer A.

(pKa of CH3COOH = 4.76)

3b
2 marks

Explain why all three buffer solutions have the same total concentration but different pH values.

3c
2 marks

The student tests the ability of each buffer to resist changes in pH.
A small volume of 1.00 mol dm-3 HCl is added to each buffer, and the new pH is recorded:

Buffer

pH before

pH after HCl added

A

4.48

4.33

B

4.76

4.59

C

5.04

4.91

Use the data to identify which buffer had the greatest buffering capacity against added acid, and explain your reasoning.

3d
2 marks

Buffer B is tested by adding a small amount of sodium hydroxide. The pH increases from 4.76 to 4.94.

Explain why the pH of this buffer changes only slightly.

3e
2 marks

The student prepares a fourth buffer using 0.200 mol dm-3 of CH3COONa only, with no CH3COOH.

Predict whether this solution can act as a buffer and justify your answer.

4a
1 mark

Every winter, road salt is spread on icy surfaces to lower the freezing point of water. A student investigates how the mass of calcium chloride (CaCl2) added to water affects the freezing point of the solution.

In each trial, a measured mass of solid CaCl2 is added to 100 g of distilled water. The solution is stirred and cooled, and the freezing point is recorded.

Write an ionic equation to show how CaCl2 dissociates in water.

4b
1 mark

Explain how the dissociation of CaCl2 helps to lower the freezing point of water.

4c
3 marks

The table below shows the freezing points recorded during the investigation.

Mass of CaCl2 added / g

Freezing point / oC

0.0

0.0

5.0

–2.6

10.0

–5.1

15.0

–7.5

20.0

–9.8

25.0

–11.6

(i) Describe the trend shown in the data.

[1]

(ii) Calculate the average decrease in freezing point per gram of CaCl2 added.

[2]

4d
1 mark

Estimate the freezing point if 30.0 g of CaCl2 were added.

4e
2 marks

Explain one reason why your estimate in (d) may not be completely accurate.

4f
2 marks

The student later discovers the CaCl2 used was slightly damp and not pure.

Explain how this would affect the results of the experiment.

4g
2 marks

A second student suggests:

“The bigger the molar mass of the salt, the more it lowers the freezing point.”

Evaluate this suggestion.

5a
2 marks

A student investigates the effectiveness of four commercial antacids in reducing stomach acidity. The active ingredients of the antacids are shown below:

Brand

Active ingredients

A

Mg(OH)2, Al(OH)3

B

NaHCO3, CaCO3

C

CaCO3

D

Mg(OH)2, Al2O3

Each tablet is crushed and added to 25.0 cm3 of 1.00 mol dm-3 hydrochloric acid (HCl). After 5 minutes, the final pH is recorded.

(i) Write a balanced chemical equation for the reaction between calcium carbonate and hydrochloric acid.

[1]

(ii) State the formula of one reactant ion in antacid tablets that causes the pH to increase..

[1]

5b
2 marks

Suggest two experimental variables, other than time, that should be controlled to ensure a fair comparison between the antacid tablets.

5c
2 marks

The results of the experiment are shown below.

Antacid

Dose used

Final pH

A

1 tablet (0.80 g)

3.42

B

1 tablet (1.25 g)

5.01

C

0.5 tablet (0.75 g)

3.48

D

1 tablet (0.95 g)

2.12

(i) Assuming that the initial pH of the acid was 1.00, calculate the change in pH for antacid A.

[1]

(ii) Calculate the uncertainty in the pH change for antacid A, using ±0.02 for each pH value.

[1]

5d
2 marks

Explain one reason why antacid B may appear more effective than C, even though both contain calcium carbonate.

5e
3 marks

The student concludes that “Antacid B is the most effective.”

Use the data to evaluate this conclusion.

5f
1 mark

The student later discovers the antacid B tablet was slightly damp.

Explain how this might affect the result.

5g
1 mark

Suggest one environmental concern with using excess antacid tablets that contain carbonate or hydroxide compounds.

6a
1 mark

A student investigates how temperature affects the position of equilibrium in the following reversible reaction:

CO (g) + H2O (g) ⇌ CO2 (g) + H2 (g)

ΔHӨ = –41.2 kJ mol-1

The student collects data at different temperatures and uses the equilibrium concentrations to calculate the equilibrium constant, K, for each trial.

The table below shows her results:

Temperature / K

ln K

500

1.24

550

0.85

600

0.51

650

0.23

700

–0.05

The student notes that the value of ln K decreases as temperature increases.

Using the data, describe how the position of equilibrium changes with increasing temperature. Support your answer with reference to the values of K.

6b
2 marks

Explain this effect using Le Châtelier’s principle and the sign of ΔHӨ.

6c
2 marks

Use the data to calculate the standard Gibbs free energy change (ΔGӨ) at 600 K.

6d
2 marks

The student then plots a graph of ln K against temperature (T) using the data.

Graph showing ln K versus temperature in Kelvin, depicting a downward linear trend from ln K 1.25 at 500 K to 0.25 at 650 K.

Use the graph to estimate the temperature at which ΔGӨ for the reaction is zero. Justify your answer.

6e
3 marks

Evaluate whether this reaction would be thermodynamically feasible at 750 K.

7a
3 marks

A student investigated the effect of temperature on the rate of hydrogen peroxide (H2O2) decomposition using manganese(IV) oxide (MnO2) as a catalyst. The volume of oxygen gas produced in the first 20 seconds was measured at five different temperatures.

2H2O2 (aq) → 2H2O (l) + O2 (g)

Temperature / oC

Volume of O2 produced / cm3

20

6.2

30

10.7

40

15.6

50

22.3

60

23.1

70

23.3

80

23.2

(i) Describe the trend shown in the data.

[1]

(ii) Use particle theory to explain the effect of increasing temperature on the rate of reaction.

[2]

7b
3 marks

(i) Calculate the average rate of reaction at 50 oC in cm3 s-1.

[1]

(ii) Calculate the percentage increase in rate when the temperature is raised from 40 oC to 50 oC.

[2]

7c
2 marks

Explain why there is only a small increase in rate between 50 oC and 60 oC.

7d
3 marks

The student repeats the experiment without MnO2.

(i) Sketch a second curve on the grid below to show how the reaction rate would differ without a catalyst. Label the curve.

Graph showing oxygen volume versus temperature. Volume increases sharply from 20°C to 50°C, then levels off near 20 cm³ from 50°C to 80°C.

[1]

(ii) Explain why the catalyst affects the rate.

[2]

7e
1 mark

Suggest one procedural improvement the student could make to increase accuracy in measuring the volume of gas produced.

8a
2 marks

The graph below shows how the solubility of carbon dioxide (CO2) in water changes with pressure at a constant temperature of 25 oC.

Graph showing a linear increase in the solubility of CO2 in water with pressure, from 0.0 g/100g at 0 atm to 0.8 g/100g at 5 atm.

(i) Describe the trend shown by the graph.

[1]

(ii) State the type of relationship shown between pressure and solubility.

[1]

8b
2 marks

Explain the trend using ideas about particle behaviour.

8c
2 marks

(i) Use the graph to determine the solubility of CO2 at 2.5 atm.

[1]

(ii) Use the graph to determine the pressure needed for a solubility of 0.580 g per 100 g H2O.

[1]

8d
1 mark

Explain why the graph passes through the origin.

8e
3 marks

(i) Explain why increasing the temperature would reduce the solubility of CO2 in water.

[2]

(ii) Predict how the graph would look if temperature increased.

[1]

8f
1 mark

Suggest one real-world situation that relies on the solubility of gases in liquids.

8g
2 marks

Explain why the dissolution of CO2 in water is considered an exothermic process.

9a
1 mark

A student investigates how different haloalkanes react with aqueous sodium hydroxide. Each halogenoalkane has the molecular formula C4H9Br, but a different structure:

Compound

Structural formula

Type of haloalkane

W

CH3CH2CH2CH2Br

Primary

X

(CH3)2CHCH2Br

Primary (branched)

Y

CH3CHBrCH3

Secondary

Z

(CH3)3CBr

Tertiary

Equal volumes of NaOH (aq) are added to each compound in separate test tubes, and the mixture is warmed. The student records the time taken for a white precipitate (AgBr) to appear.

Compound

Time for precipitate to appear / s

W

95

X

80

Y

42

Z

11

Identify the compound that reacted the fastest and suggest the type of mechanism involved.

9b
2 marks

Explain why compound Z reacts faster than compound W, using ideas about carbocation stability and mechanism.

9c
2 marks

The student uses polar protic solvents in all trials.

Explain how this affects the likely substitution mechanism.

9d
1 mark

Compound W is tested again using an aprotic solvent. The rate increases significantly. Suggest a reason for this observation.

9e
2 marks

Predict the major organic product formed when compound Z reacts with NaOH (aq). State the type of reaction.

9f
2 marks

Suggest one experimental method, other than measuring rate, that could help distinguish between the SN1 and SN2 mechanisms.