Interpreting Voronoi Diagrams (DP IB Applications & Interpretation (AI)): Revision Note

Did this video help you?
Interpreting Voronoi diagrams
What is a Voronoi diagram used for?
Voronoi diagrams are often used in land management to work out where the best location would be according to the locations of specific sites
They can show where to put a site to make sure that it is
Closest to a particular site
Closer to one site than another
Equidistant from two or three specific sites
As far as possible from any other site
How do I use Voronoi diagrams?
You may be asked to find the shortest distance from a point to its closest site
Use Pythagoras’ theorem to find the distance between the given coordinate and the site in the same region as it
If the coordinate is on an edge then there will be two sites equidistant from it
You may be asked to find the point which is furthest from any of the sites
This will be one of the vertices
To choose which vertex find the distances between each vertex and a site in one of the connecting cells
You may be asked to estimate the success of a new site
This is done by looking at the data for the nearest site
The prediction for the new site would be assumed to be the same
This is called nearest neighbour interpolation
Worked Example
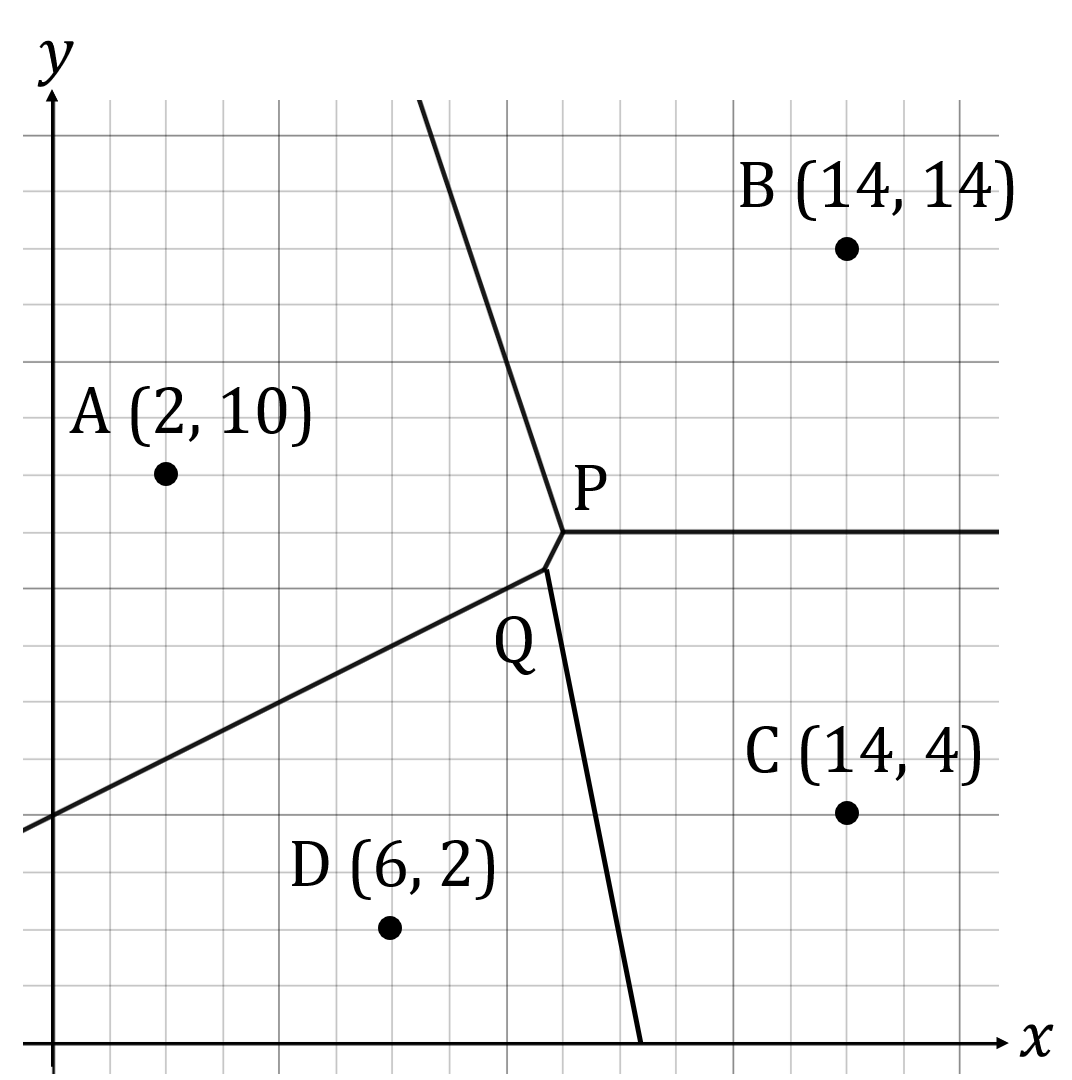
The Voronoi diagram below shows the four sites A, B, C and D with coordinates (2, 10), (14, 14), (14, 4), and (6, 2) respectively. 1 unit represents 10 km.
Answer:
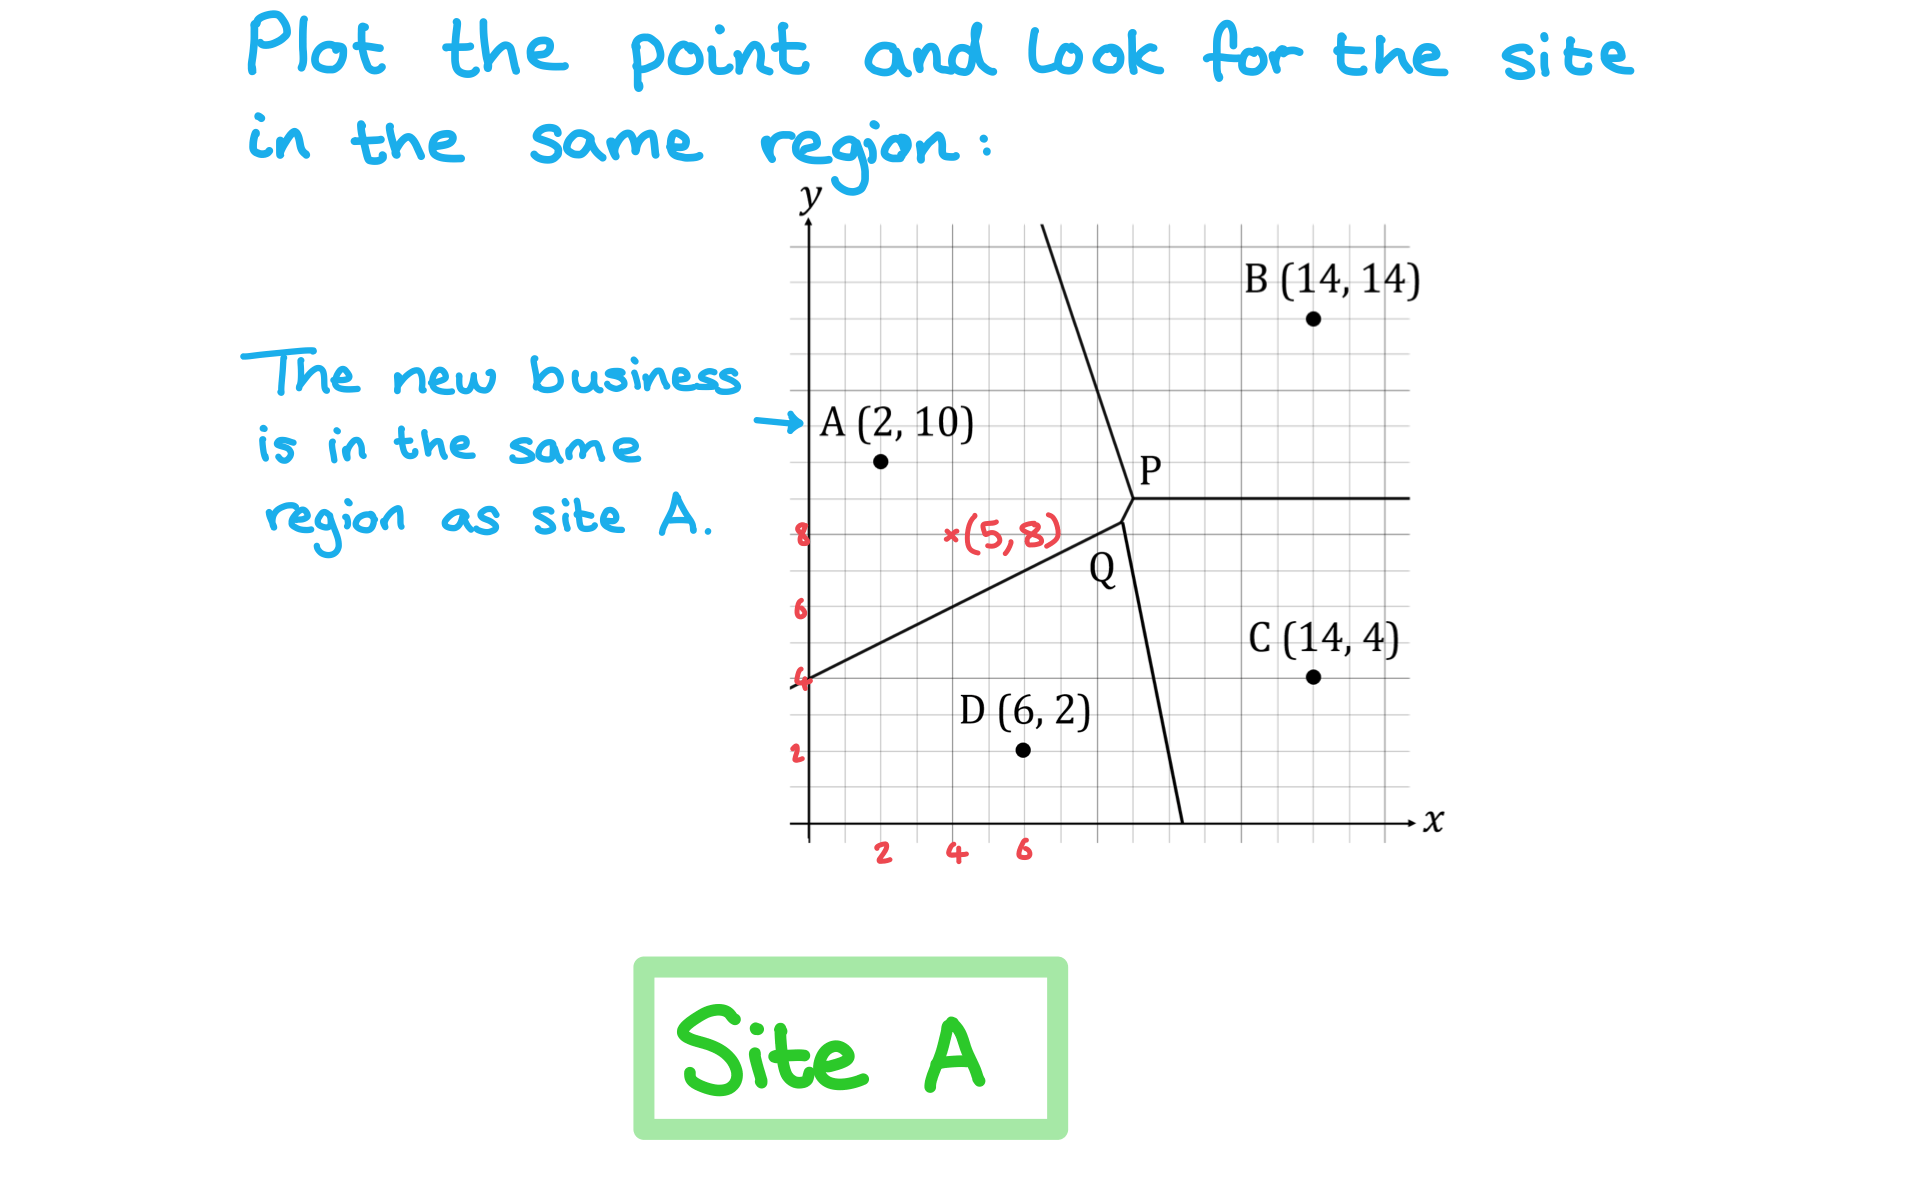
i) State which site a new business opening at the coordinate (5, 8) should look at to predict future sales.
Answer:
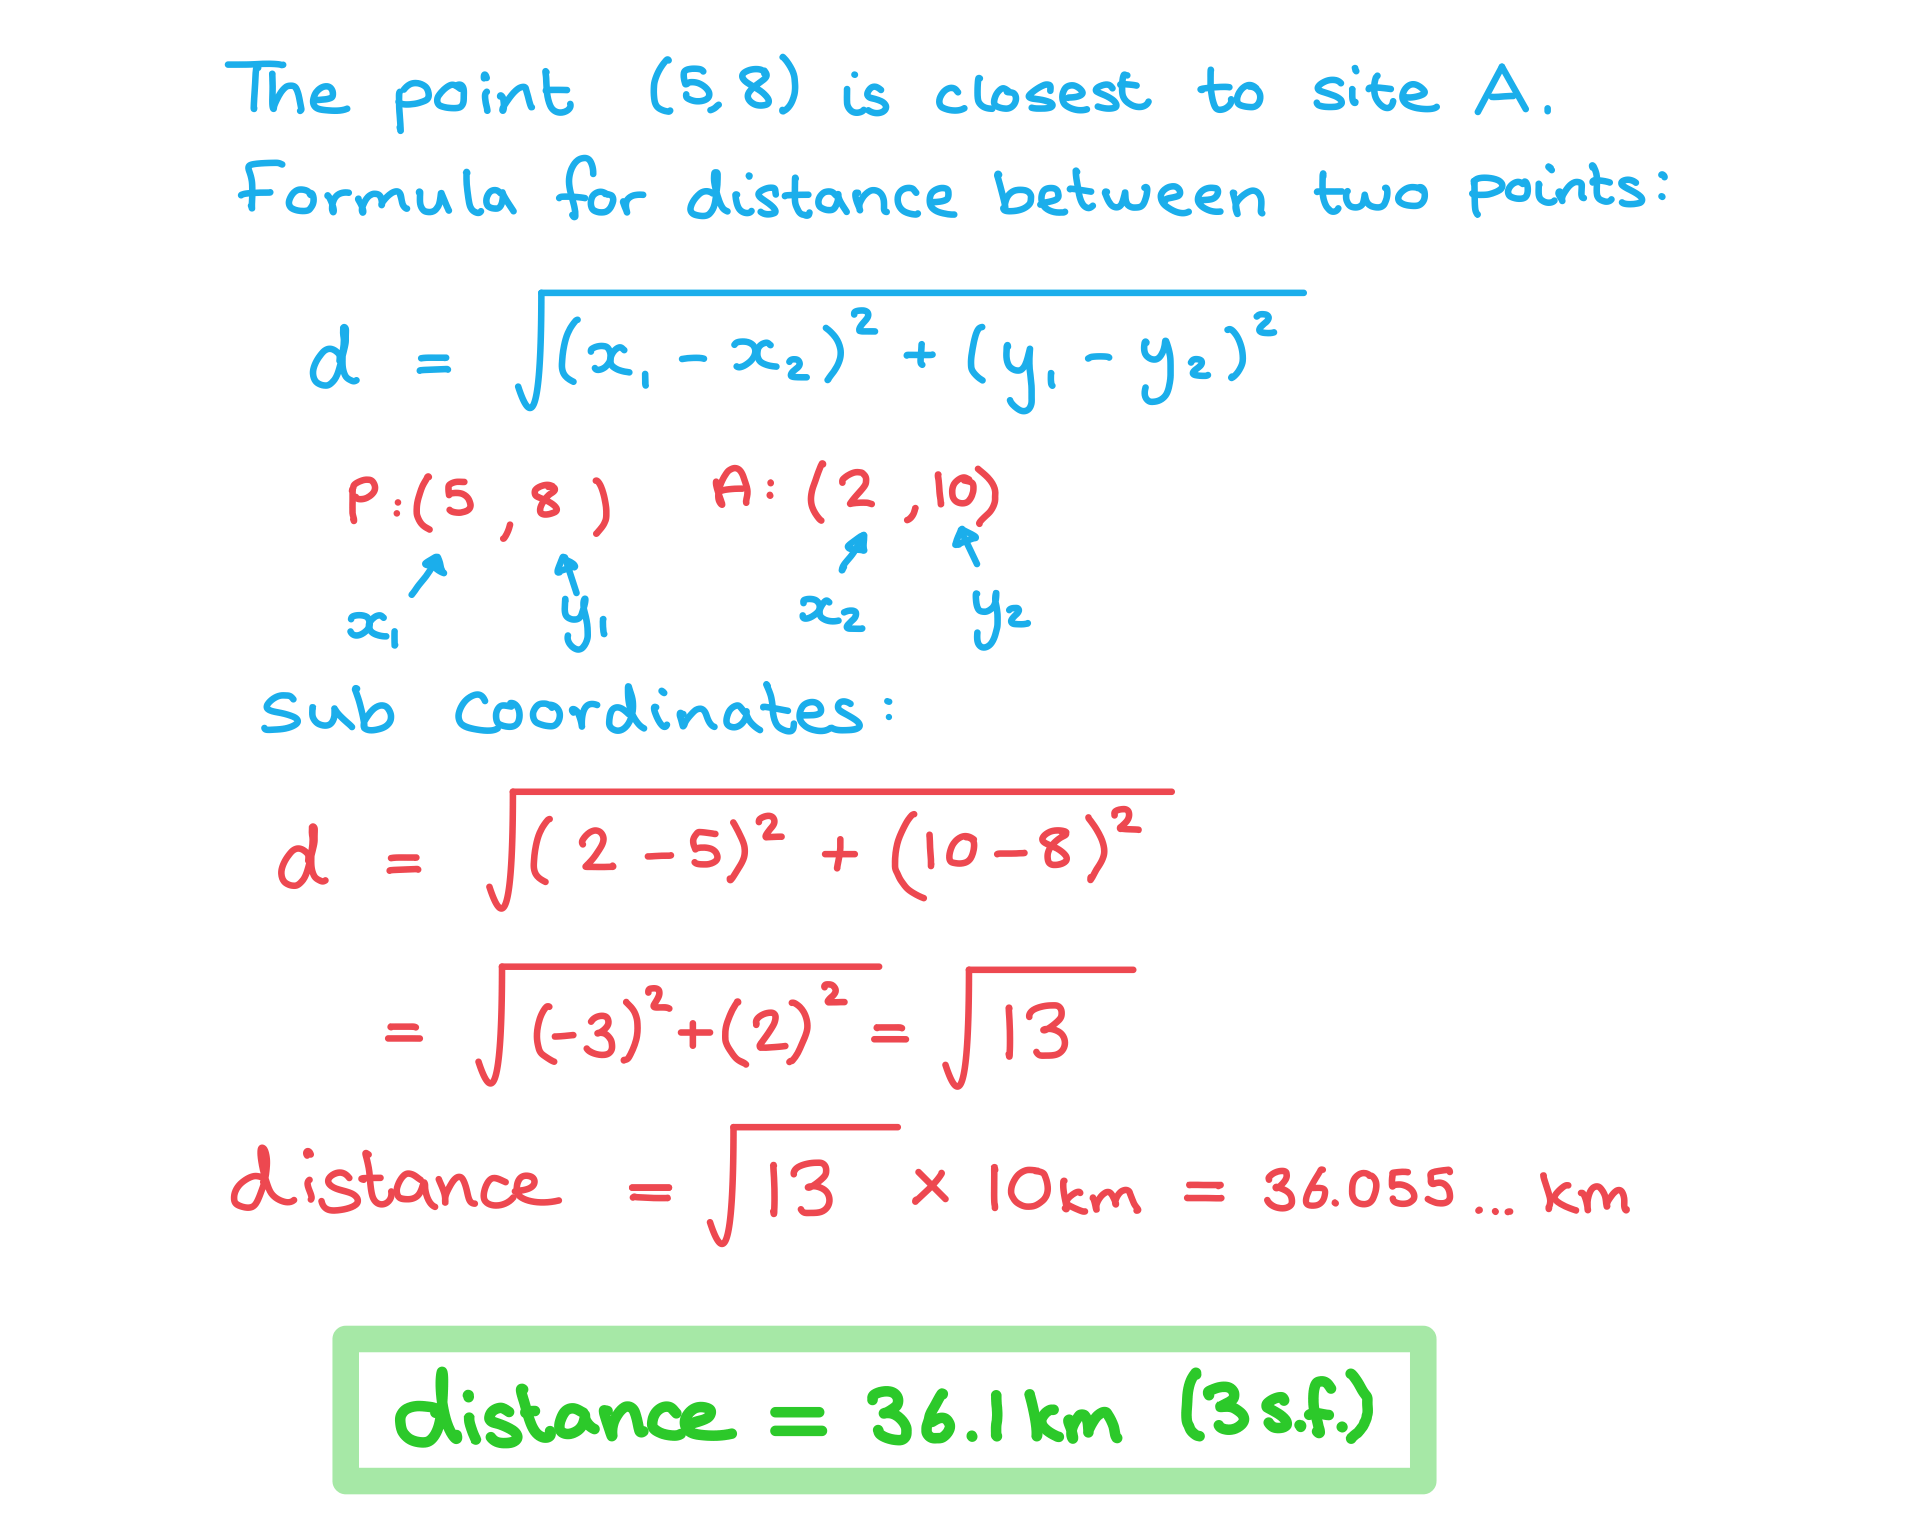
ii) Find the shortest distance from the point (5, 8) to its nearest site.
Answer:

Unlock more, it's free!
Join the 100,000+ Students that ❤️ Save My Exams
the (exam) results speak for themselves:

Was this revision note helpful?
