Integration (DP IB Applications & Interpretation (AI): SL): Exam Questions

4 hours28 questions
1a
2 marks

A function f is defined by the equation  f(x)=−3x+35.

Sketch the graph of  y=f(x) in the interval  0≤x≤10.

1b
3 marks

Use your sketch from part (a), along with relevant area formulae, to work out the value of the integral

∫19(−3x+35)dx

You should not use your GDC to find the value of the integral.

2a
3 marks

A function f is a piecewise linear function defined by

f(x)={12(x+7),x≤35,3<x<1035−3x,x≥10

Sketch the graph of y=f(x) in the interval 0≤x≤12.

2b
4 marks

Use your sketch from part (a), along with relevant area formulae, to work out the value of the integral

∫111f(x)dx

1a
2 marks

Let f'(x)=5x−2. The graph of f passes through the point A(4, 2).

Find the gradient of the graph of f at A.

1b
2 marks

Find the equation of the tangent to the graph of f at A. Give your answer in the form y=mx+c.

1c
4 marks

Find f(x).

2a
2 marks

Let f'(x)=−2x2+11. The graph of f passes through the point P(3, 8).

Find the gradient of the graph of f at P.

2b
2 marks

Find the equation of the tangent to the graph of f at P. Give your answer in the form y=mx+c.

2c
4 marks

Find f(x).

3a
2 marks

The following table shows the x- and y-coordinates of five points that lie on the curve y=f(x).

x

0

0.25

0.5

0.75

1

y=f(x)

1

2.25

4

6.25

9

Use the trapezoidal rule with the values in the table to estimate the area under the curve for 0≤x≤1.

3b
2 marks

The equation of the curve is y=(2x+1)2.

Find the exact area under the curve for 0≤x≤1.

3c
2 marks

Find the percentage error between the estimate in part (a) and the exact value in part (b).

4a
4 marks

The following diagram shows an arch that is 4.5 m tall and 3 m wide. The arch meets the x-axis at the origin, O, and at the point P, and its vertex is at the point V. The arch can be modelled by the curve with equation y=x(ax+6), where x and y are measured in metres.

ib4-ai-sl-5-2-ib-maths-medium

Find

(i) the coordinates of P

(ii) the coordinates of V

(iii) the value of a.

4b
2 marks

Find the cross-sectional area under the arch.

5a
2 marks

The diagram below shows part of the curve y=−4x2+px+q. The curve crosses the x-axis at the points A and B, and its vertex is V(2.5, 6). The shaded region R is enclosed by the curve and the x-axis.

ib5-ai-sl-5-2-ib-maths-medium

Find the values of p and q.

5b
2 marks

Find the coordinates of A and B.

5c
2 marks

Find the area of R.

6a
2 marks

The following diagram shows part of the graph of f(x)=(5−2x)(2+3x), x∈ℝ. The shaded region R is bounded by the x-axis, the y-axis and the graph of f.

Graph of y = f(x), a parabola opening downwards that crosses the negative x-axis, the positive y-axis and the positive x-axis. The region R, bounded by the y-axis, the positive x-axis and the curve, is shaded.

Write down an integral for the area of R.

6b
1 mark

Find the area of R.

6c
2 marks

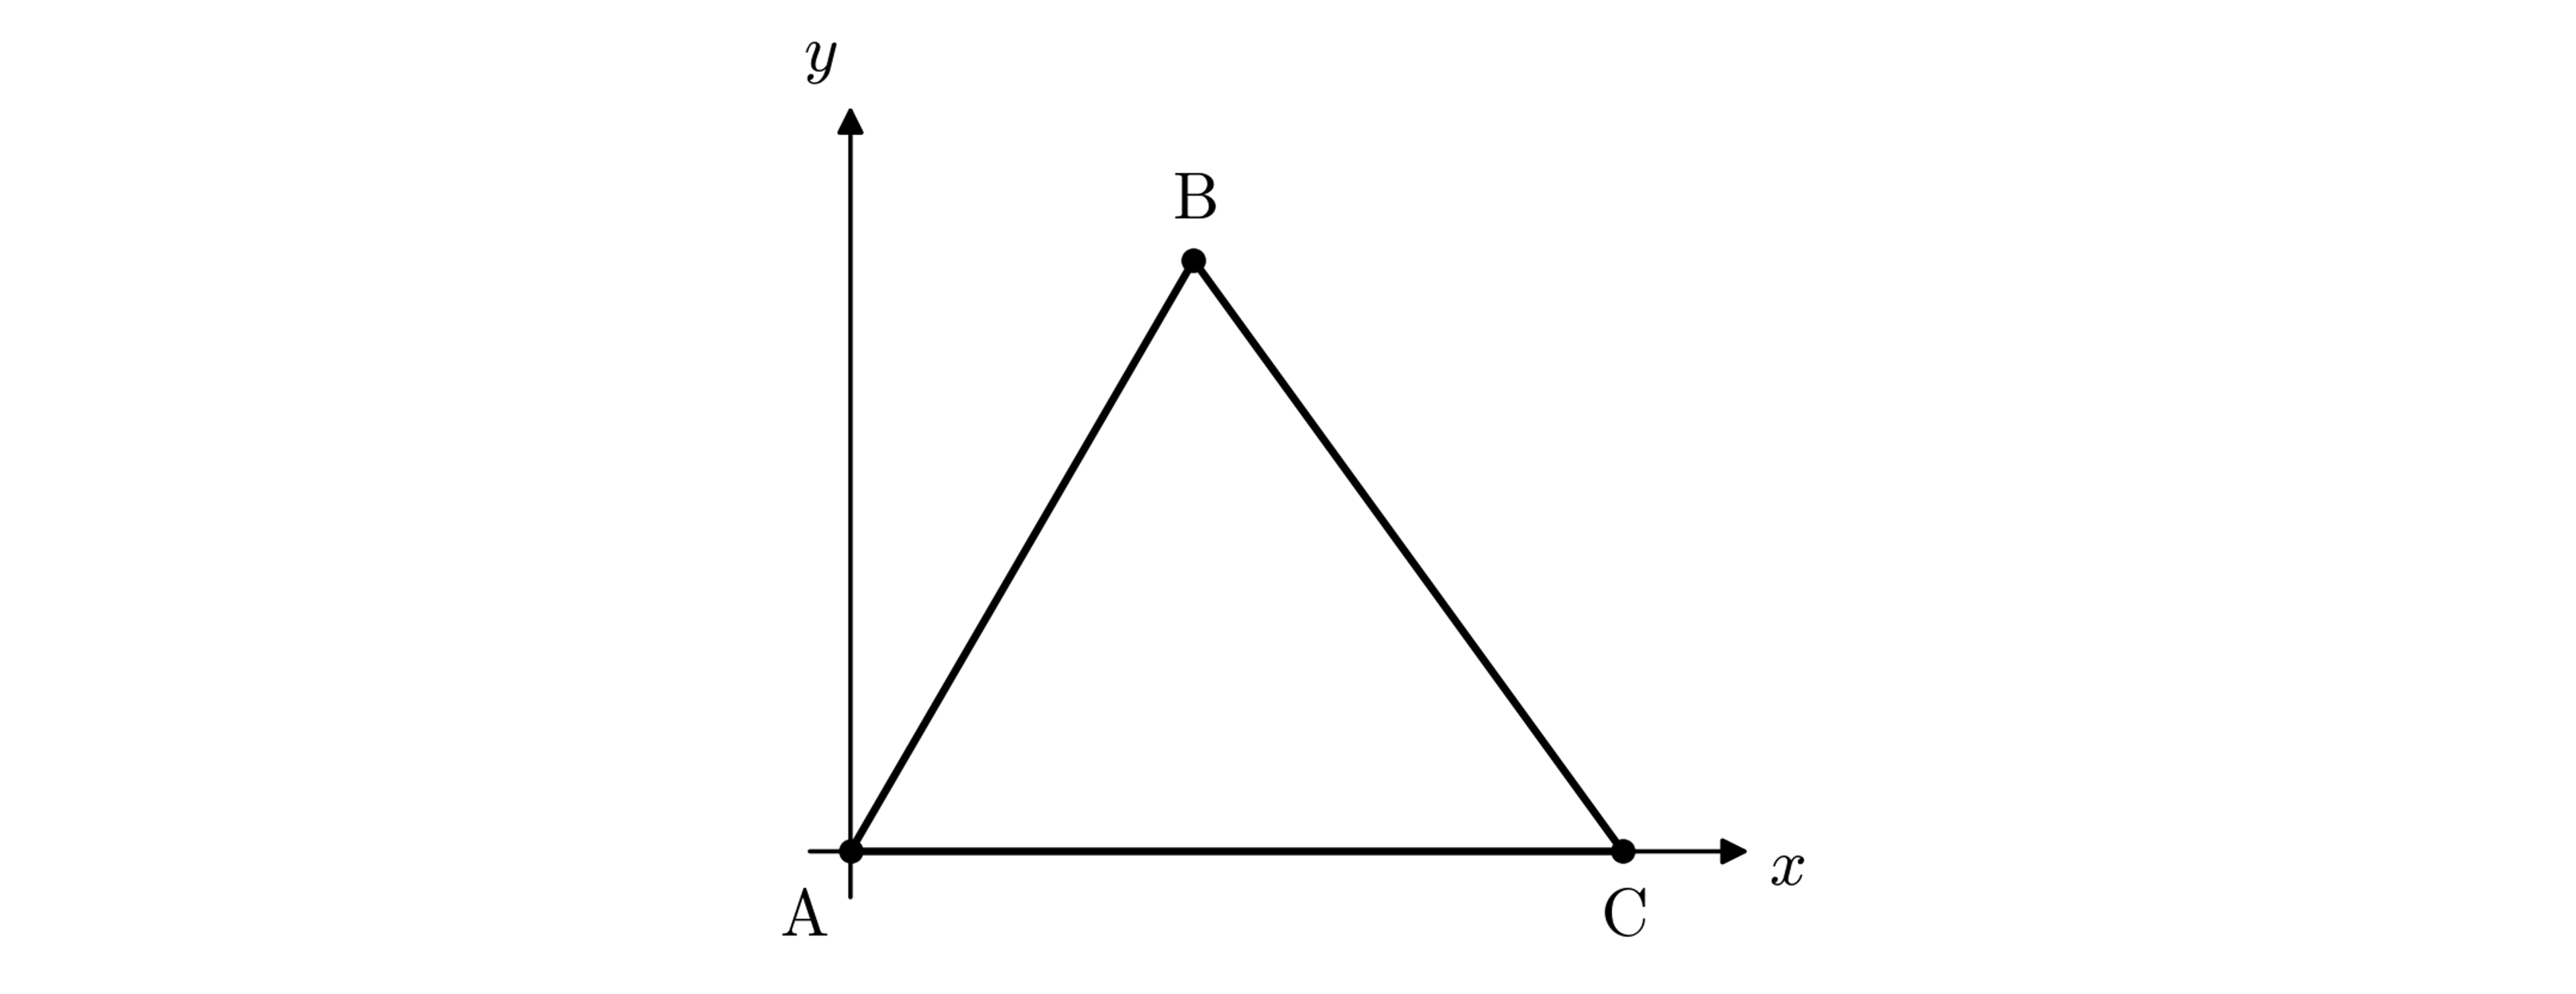
The three points A(0, 0), B(4, h) and C(9, 0) are the vertices of a triangle.

Triangle ABC on a pair of coordinate axes. A is at the origin, C is on the positive x-axis, and B is above the x-axis, between A and C.

The area of the triangle is equal to the area of R.

Find the value of h.

7a
3 marks

A rice farm sells x kg of rice each week. The weekly profit, P dollars, from the sale of x kg of rice satisfies

dPdx=−0.02x+6, for x≥0.

Find the amount of rice, in kg, that should be sold each week to maximise the profit, and justify that this gives a maximum.

7b
5 marks

The profit from selling 250 kg of rice in a week is 480 dollars.

Find P(x).

8a
3 marks

A paint company sells x hundred litres of paint each week. The weekly profit, P euros (€), from the sale of x hundred litres of paint satisfies

dPdx=−1.9x+145, for x≥0.

Find the number of litres of paint that should be sold each week to maximise the profit.

8b
5 marks

The profit from selling 7000 litres of paint in a week is €5000.

Find P(x).

9a
2 marks

The shaded region in the diagram below shows the cross-section of a river, where x and y are measured in metres. The riverbed, the curved edge of the region, can be modelled by an equation of the form y=q(x−6)2. O is the origin, and O, A, B and C are the vertices of a rectangle. The deepest point of the riverbed, V, lies on the x-axis.

ib7-ai-sl-5-2-ib-maths-medium

Find

(i) the coordinates of V

(ii) the area of the rectangle OABC.

9b
2 marks

Determine the value of q.

9c
3 marks

Find the area of the cross-section of the river.

10a
2 marks

The shaded region in the diagram below shows the cross-section of a trough, where x and y are measured in centimetres. The curved bottom of the trough can be modelled by an equation of the form y=r(x−15)2. Point O is the origin, and points O, A, B and C are the vertices of a rectangle. Point V, the lowest point of the trough, lies on the x-axis.

ib10-ai-sl-5-2-ib-maths-medium

Find the value of r.

10b
4 marks

Find the cross-sectional area of the trough.

10c
2 marks

The trough is 1.2 m long.

Find the volume of the trough. Give your answer in cm3.

11a
2 marks

A company is designing a plastic piece for a new game. The piece is to be in the form of a prism, with cross-section the shaded region R in the following diagram.

ib5-ai-sl-5-2-ib-maths-hard

Region R is bounded by the positive x-axis, the positive y-axis and the curve with equation y=6(x−3)2x−9. All lengths are in centimetres.

Find the coordinates of the points where the curve meets the x-axis and the y-axis.

11b
4 marks

The volume of the piece is to be 30 cm3.

Find the length of the piece, giving your answer correct to 3 significant figures.

12a
3 marks

The following diagram shows part of the graph of y=12(x−1)(x+5).

ib4-ai-sl-5-2-ib-maths-hard

The shaded region S is bounded by the graph, the x-axis and the line x=2.

(i) Write down an integral for the area of S.

(ii) Find the area of S. Give your answer as an exact value.

12b
3 marks

The shaded region R is bounded by the graph, the x-axis, the y-axis and the horizontal line through the point on the graph where x=2.

Find the area of R. Give your answer as an exact value.

13
6 marks

Let

f'(x)=92x2+7x−2

The graph of f passes through the point (−3, −112).

Find f(x).

14a
5 marks

Let f'(x)=ax−1, where a∈ℝ is a constant. The diagram below shows part of the graph of f, with its x- and y-intercepts labelled.

ib3-ai-sl-5-2-ib-maths-veryhard

Find

(i) the value of a

(ii) f(x)

(iii) the coordinates of M.

14b
3 marks

Find the area of the region enclosed by the graph of f and the x-axis.

15a
5 marks

Let f'(x)=4ax+6, where a∈ℝ is a constant. The diagram below shows part of the graph of f. The graph crosses the x-axis at x=−1 and x=4, and its vertex is at V.

ib3-ai-sl-5-2-ib-maths-hard

Find

(i) the value of a

(ii) f(x)

(iii) the coordinates of V.

15b
3 marks

Find the area of the region enclosed by the graph of f and the x-axis.

16a
3 marks

The following diagram shows part of the graph of f(x)=(2x+1)(4x2−10x+41), x∈ℝ. The shaded region R is bounded by the x-axis, the y-axis and the graph of f.

ib6-ai-sl-5-2-ib-maths-hard

(i) Write down an integral for the area of R.

(ii) Find the area of R.

16b
3 marks

ABCD is a parallelogram with vertices A(0, 0), B(1, 73), C and D(a, 0), as shown in the diagram below. The area of ABCD is equal to the area of R.

ib6b-ai-sl-5-2-ib-maths-hard

Find the value of a. Hence find the coordinates of C. Give your answers as exact values.

17
6 marks

A company is designing a piece for one of the plastic wargaming models they produce. The piece is to be in the form of a prism, with a cross-sectional area as indicated by the shaded region R in the following diagram:

ib5-ai-sl-5-2-ib-maths-veryhard

Region R is bounded, as shown, by the positive x-axis and the curve with equation y=1x−3−x2+6x−4. All units are in centimetres.

Given that the model piece will have a volume of 50.3 cm3, find the length of the piece.

18
7 marks

Let

f'(x)=−3x2+12x2−23x+2, x>0

The graph of f passes through the point (6, 652).

Find f(x).

1a
3 marks

A curve has equation y=−x3+8x2−13x+6. The region R is enclosed by the curve and the x-axis.

Sketch the curve, shading the region R.

1b
3 marks

Use the trapezoidal rule with 5 strips to estimate the area of R.

1c
2 marks

Explain, using your sketch from part (a), why it is not possible to tell immediately whether your estimate in part (b) is an underestimate or an overestimate.

1d
2 marks

Find the exact area of R.

1e
2 marks

Find the percentage error in your estimate from part (b).

2a
3 marks

The shaded region R in the following diagram is bounded by the x-axis, the line y=8x−4 and the curve y=−x3+x2+10x+8.

ib8-ai-sl-5-2-ib-maths-hard

Find the coordinates of

(i) the point of intersection of the curve and the line

(ii) the point of intersection of the line and the x-axis

(iii) the point of intersection of the curve and the x-axis that is shown in the diagram.

2b
5 marks

Find the area of R.

3a
6 marks

After analysing several years of data, a fast food company has found that the rate of change of its weekly sales can be modelled by

dMdx=−0.068x3+0.72x2−0.88x−1.9, for 0≤x≤10,

where M is the number of meals sold in a week, in thousands, and x is the amount spent on advertising in the previous week, in thousands of euros.

In a week after 2000 euros was spent on advertising, 5988 meals were sold.

Find an expression for M(x).

3b
7 marks

Find the maximum number of meals that the company can expect to sell in a week, and the amount that it should spend on advertising in the previous week to achieve this. Give your answers to the nearest meal and the nearest euro respectively. Justify that the value you find is a maximum.

4
6 marks

Celebrity chef Pepper Bee has opened a new restaurant and is charging diners £630 for a piece of his signature ‘Croesus’ cake. The chef claims that the price reflects the high cost of the gold foil that is placed on top of each slice of cake, but a suspicious and disgruntled customer has decided to investigate this claim.

The shaded area in the diagram below shows the shape of the piece of gold foil that is placed on top of each slice of cake:

ib4-ai-sl-5-2-ib-maths-veryhard

The shape is that of a rectangle, from which four identical curved sections have been removed. The rectangle is bounded by the positive x- and y-axes and the lines x=10 and y=6. The shape of one of the curved sections in the diagram can be described by the curve with equation

y=−14(2x−7)(2x−13)

All units are given in centimetres.

Given that gold foil costs £0.004788 per mm2, work out the cost of the gold foil on a piece of Pepper Bee’s Croesus cake. Give your answer to 2 decimal places.

5a
2 marks

A curve has equation y=x3−5x2+2x+8.

Sketch the curve.

5b
3 marks

Use the trapezoidal rule with n=5 to estimate the value of

∫−132(x3−5x2+2x+8)dx

5c
2 marks

Explain, using your sketch from part (a), why your estimate in part (b) is an underestimate.

5d
4 marks

(i) Find the exact value of the integral in part (b).

(ii) Find the percentage error in your estimate from part (b).

5e
1 mark

Explain how you could change your method in part (b) to obtain a more accurate estimate.

6a
2 marks

The shaded region R in the following diagram is bounded by the curves y=5x2−12x+8 and y=−3x2+10x+29.

ib8-ai-sl-5-2-ib-maths-veryhard

The two curves intersect at the points A and B, as shown.

Find the x-coordinates of A and B.

6b
4 marks

Find the area of R.

1a
3 marks

The following diagram shows part of the graph of f(x)=12(2x+1)(x2−52x+8), x∈ℝ. The shaded region R is bounded by the x-axis, the y-axis and the graph of f.

ib6-ai-sl-5-2-ib-maths-veryhard

Find the area of region R.

1b
6 marks

A trapezoid ABCD is shown below.

ib6a-ai-sl-5-2-ib-maths-veryhard

[AB] is perpendicular to [AD] and parallel to [CD], and CD=3445. The coordinates of the points A, B and D are (0, 1), (910, p) and (34, 716) respectively, where p>0 is a constant.

Given that ABCD has the same area as the region R above, find the value of p, the y-coordinate of point B.

2a
5 marks

Donty is a would-be social media celebrity who is obsessed with the number of likes his posts receive. He hires a statistician to study his social media accounts. After analysing several years of data, she finds that the rate of change of his number of likes can be modelled by

dLdx=−0.164x3+2.73x2−12.7x+15.3, for 0≤x≤12,

where L is the number of likes received on a given day, in thousands, and x is the amount of new video content, in hours, that Donty uploaded on the previous day. Because of technical limitations, Donty cannot upload more than 12 hours of new video content in a day.

On a day after Donty uploaded 5 hours of new video content, he received 36 075 likes.

Find an expression for L(x).

2b
6 marks

Find the maximum and the minimum number of likes that Donty can expect to receive in a day, and the corresponding number of hours of new video content that he should upload on the previous day. Justify that the values you find are the maximum and the minimum.

2c
4 marks

(i) For the maximum found in part (b), calculate the number of likes received for each minute of new video content uploaded on the previous day.

(ii) State, with a reason, whether the value found in part (c)(i) is the greatest number of likes per minute of new content that Donty can achieve.