Further Functions & Graphs (DP IB Applications & Interpretation (AI): SL): Exam Questions

4 hours31 questions
1a
3 marks

Consider the function g(x)=4−x.

On the following grid, sketch the graph of y=g(x), labelling any axis intercepts.

q4-2-2-easy-ib-ai-sl-maths
1b
2 marks

Find

(i) g(−5)

(ii) the value of x such that g(x)=12.

1c
2 marks

(i) Write down the largest possible domain of g.

(ii) Write down the corresponding range of g.

1a
1 mark

The function f is defined by f(x)=54x−13, for −2<x<20.

Find f(52).

1b
2 marks

Find the range of f.

1c
2 marks

Find the value of f−1(122).

1d
1 mark

Write down the range of f−1.

2a
2 marks

Consider the function f(x)=−6x−3, for −5≤x≤3.

Find

(i) f(2)

(ii) the value of x such that f(x)=15.

2b
2 marks

Find the range of f.

2c
1 mark

Write down the domain of f−1.

3a
2 marks

Consider the functions f(x)=−x5+2020 and g(x)=1(1−x)3−2.

Find the coordinates of the y-intercepts for the graph of

(i) f

(ii) g.

3b
3 marks

Find the coordinates of the x-intercepts for the graph of

(i) f

(ii) g.

3c
2 marks

For the graph of g, find the equation of

(i) the vertical asymptote

(ii) the horizontal asymptote.

4a
2 marks

Consider the functions f(x)=x−4−2021 and g(x)=2−x−1.

Find the largest possible domain and the range of g.

4b
2 marks

For the graph of f, write down the equation of

(i) the vertical asymptote

(ii) the horizontal asymptote.

4c
2 marks

Find the coordinates of the x-intercepts of the graph of

(i) f

(ii) g.

5a
4 marks

Consider the functions f(x)=−x2−x+6 and g(x)=(2x+1)2−9.

On the axes below, sketch the graphs of y=f(x) and y=g(x), labelling the coordinates of the vertex of each graph.

q6a-2-2-easy-ib-ai-sl-maths
5b
2 marks

Find the coordinates of the points of intersection of the graphs of f and g.

5c
2 marks

Find the x-intercepts of the graphs of f and g.

6a
1 mark

The diagram below shows part of the graph of the function f(x)=−x2+bx+c, where b and c are integers. The points P(−2, 0) and R(6, 0) are the x-intercepts, Q(0, 12) is the y-intercept, V is the vertex of the graph of f and O is the origin.

4s4VVZsH_q7a-2-2-medium-ib-ai-sl-maths

Write down the value of c.

6b
3 marks

Find the value of b and write down f(x).

6c
2 marks

Write down the coordinates of V.

7a
4 marks

The graph of the function g(x)=ax2+bx+c crosses the y-axis at (0, −16) and the x-axis at (−4, 0). The graph of g can be obtained from the graph of y=2x2 by a translation.

(i) Find the values of a, b and c.

(ii) Write down g(x).

7b
1 mark

Find the other x-intercept of the graph of g.

7c
2 marks

Write down the coordinates of the vertex of g(x).

8a
1 mark

The diagram below shows the graph of the function f(x)=2sin(2x), for 0≤x≤360, where x is measured in degrees.

q8a-2-2-medium-ib-ai-sl-maths

Write down the amplitude of f.

8b
2 marks

Calculate the period of f(x).

8c
4 marks

Find all the values of x for which f(x)=−1.

9a
4 marks

The diagram below shows part of the graph of the function f(x)=x3−x2−4x+1.

q10-2-2-easy-ib-ai-sl-maths

Points A, C, D and F represent where the graph of f intersects the coordinate axes. Write down the coordinates of

(i) A

(ii) C

(iii) D

(iv) F.

9b
2 marks

Points B and E represent the local maximum and the local minimum of the graph of f. Write down the coordinates of

(i) B

(ii) E.

10a
2 marks

The diagram below shows part of the graph of the function f(x)=2x−3.

q11a-2-2-medium-ib-ai-sl-maths

Find

(i) f(2)

(ii) the value of x for which f(x)=−1.

10b
1 mark

The point P is the y-intercept of the graph of f. Write down the coordinates of P.

10c
1 mark

The point Q is the x-intercept of the graph of f. Write down the coordinates of Q.

10d
2 marks

Draw the line y=−3 on the graph above.

Write down the number of solutions to the equation f(x)=−3.

11a
1 mark

The graph of a quadratic function has equation y=14x2+bx+c, where b, c∈ℤ, and the axis of symmetry is x=−4.

A blank grid of unit squares, with x from -7 to 1 and y from -2 to 7, and the axes labelled at -6, -4 and -2 on the x-axis and at 2, 4 and 6 on the y-axis

Draw the axis of symmetry on the grid above.

11b
3 marks

The graph of the quadratic function intersects the x-axis at the points A(−6, 0) and B.

(i) Write down the coordinates of B.

(ii) Find the values of b and c.

11c
4 marks

(i) Mark and label A and B on the grid above.

(ii) Write down the coordinates of the vertex, V, and label it on the grid above.

(iii) Write down the coordinates of the y-intercept, C, and label it on the grid above.

(iv) Draw the graph of the quadratic function on the grid above.

12a
2 marks

A rectangle has length 4x and width x.

Find an expression, in terms of x, for

(i) the perimeter P of the rectangle

(ii) the area A of the rectangle.

12b
2 marks

Show that P(A)=5A.

12c
3 marks

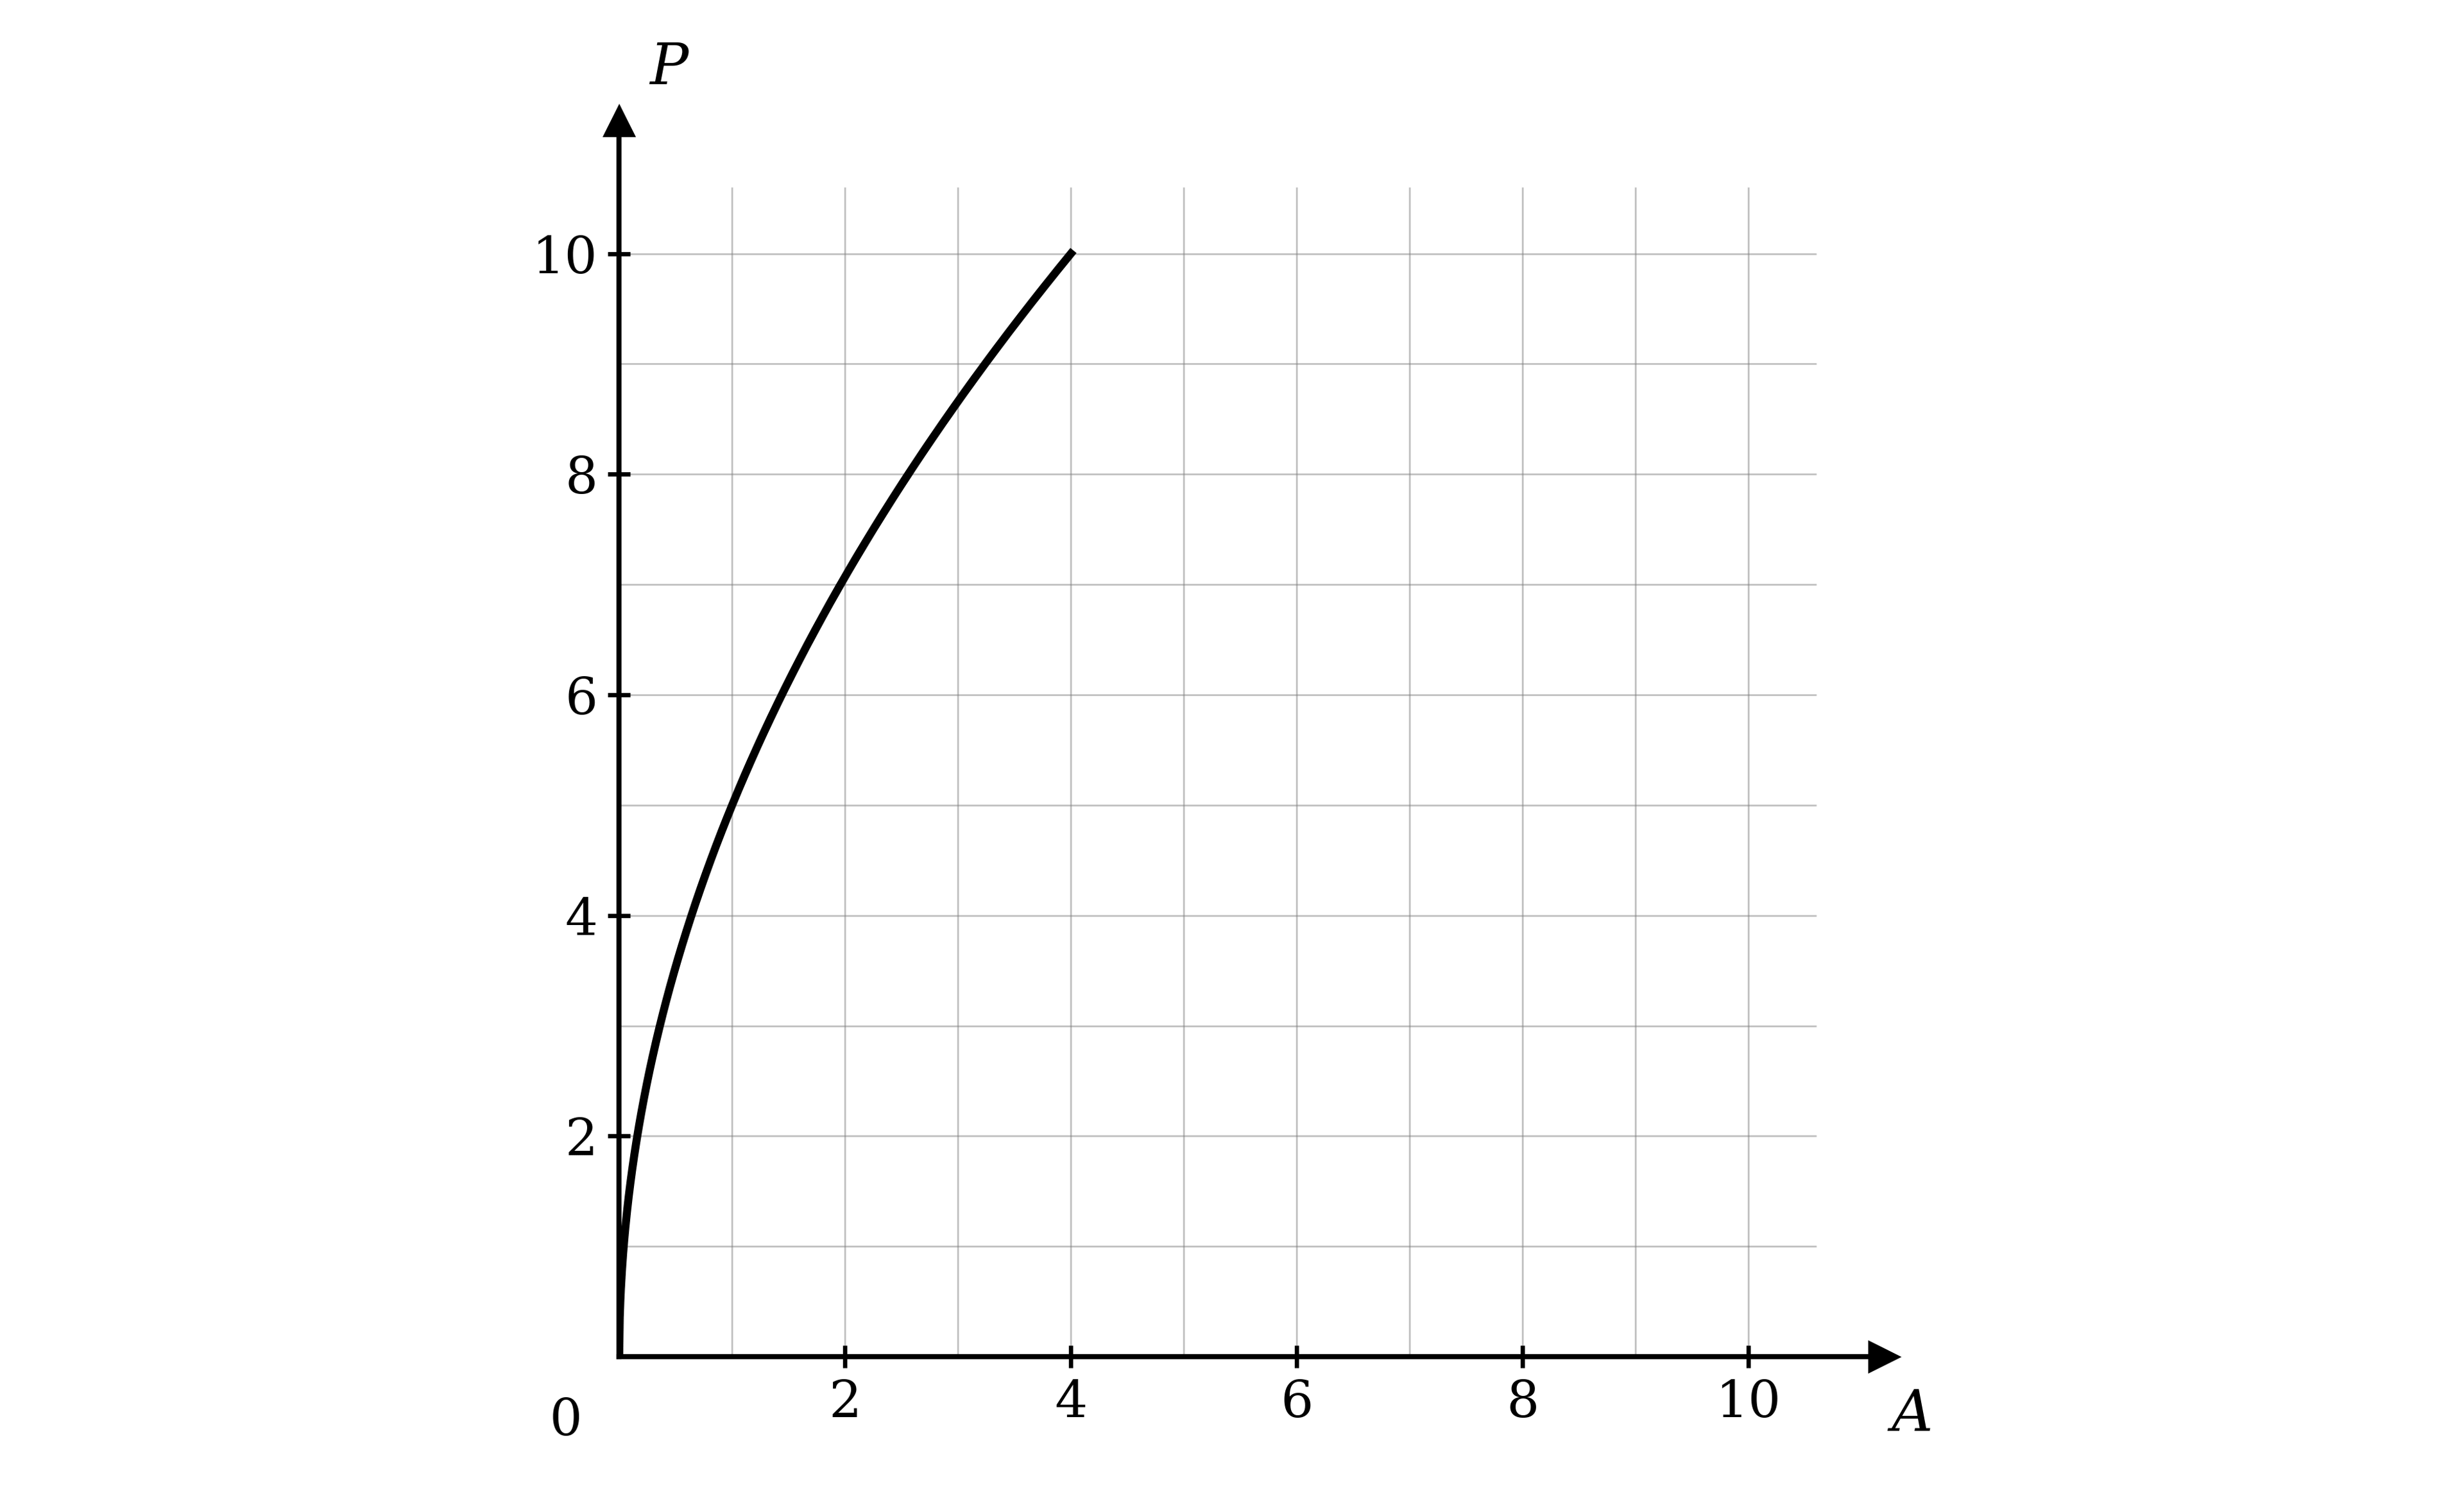
The graph of P, for 0≤A≤4, is shown on the following grid.

Grid from 0 to 10 on both axes, with A on the horizontal axis and P on the vertical axis, showing the graph of P, a curve rising from the origin to the point (4, 10)

On the same grid, sketch the graph of P−1.

13a
1 mark

A function is defined by f(x)=4−125x+9, for x∈ℝ, x≠a.

Write down the value of a.

13b
2 marks

Find the range of f.

13c
2 marks

Find the value of f−1(2).

14a
2 marks

Let f(x)=72(x−7)−5, for x≠7.

Find the coordinates of the point where the graph of f crosses

(i) the x-axis

(ii) the y-axis.

14b
2 marks

Write down the equation of

(i) the vertical asymptote of the graph of f

(ii) the horizontal asymptote of the graph of f.

14c
2 marks

Let g(x)=2(1−2x), for x∈ℝ. The graphs of f and g intersect at the points P and Q.

Write down the coordinates of P and of Q.

14d
2 marks

Find PQ.

15a
1 mark

Let f(x)=x2−3x+2. The diagram below shows part of the graph of f.

q1a-2-2-hard-ib-ai-sl-maths

Another function is defined by g(x)=2−x.

On the same axes, sketch the graph of g.

15b
3 marks

The graphs of f and g intersect at the points A and B. Find the coordinates of A and B, and label them on the diagram.

15c
2 marks

Find AB.

16a
2 marks

Consider the function f(x)=a(0.75)x+b, where a and b are constants. The graph of f passes through the points (0, 18) and (2, 11) and is shown below.

l7Mb5_Ct_q4a-2-2-hard-ib-ai-sl-maths

Write down two equations relating a and b.

16b
2 marks

Find the value of a and the value of b.

16c
1 mark

Write down the equation of the horizontal asymptote of the graph of f.

17a
4 marks

The graph of the function f(x)=ax2+bx+c crosses the y-axis at (0, −12) and the x-axis at (3, 0). The graph of f can be obtained from the graph of y=−4x2 by a translation.

Find the values of a, b and c.

17b
1 mark

Find the other x-intercept of the graph of f.

17c
2 marks

Determine the coordinates of the maximum value of f(x) .

18a
2 marks

The axes below show the graph of the piecewise function f.

q11a-2-2-hard-ib-ai-sl-maths

The gradient of the graph of f is 0 for a≤x<b.

Find the values of a and b.

18b
4 marks

Complete the definition of f.

f(x)={…,0≤x<2…,2≤x<3…,3≤x≤4

19a
3 marks

Let f(x)=2x4−2x3−4x2+x+1, where x∈ℝ.

Solve the inequality f(x)<0.

19b
3 marks

For the graph of f, find the coordinates of the

(i) local maximum point.

(ii) local minimum points.

1a
4 marks

The perimeter, P, and the area, A, of a square with sides of length x are given by P=4x and A=x2.

Find an expression for

(i) P in terms of A

(ii) A in terms of P.

1b
2 marks

Given that P−1(40)=A(k), find the value of k.

2a
1 mark

A function is defined by f(x)=1(x−3)2+2, for x≠p.

Find the value of p.

2b
2 marks

Write down the equation of

(i) the vertical asymptote of the graph of f

(ii) the horizontal asymptote of the graph of f.

2c
1 mark

Write down the range of f.

2d
4 marks

The line l intersects the graph of f at the points where x=1 and x=4.

Find the equation of l. Give your answer in the form ax+by+d=0, where a, b and d are integers.

3a
2 marks

The diagram below shows the graph of the function f(x)=8cos(48x)−3, for −5≤x≤5, where x is measured in degrees.

q6a-2-2-hard-ib-ai-sl-maths

For the graph of f, find

(i) the x-intercepts

(ii) the y-intercept.

3b
2 marks

Write down the range of f.

3c
4 marks

The two local minimum points and the local maximum point of the graph of f form a triangle. Find the area of this triangle.

4a
4 marks

The function f is a quadratic in the form f(x)=ax2+bx−2, for −10≤x≤10.

The graph of f has x-intercepts (1+52, 0) and (1−52, 0).

Find the values of a and b.

4b
2 marks

Another function is defined by g(x)=6(0.8)−x−1, for −10≤x≤10.

The graphs of f and g intersect at the points A and B.

Find the coordinates of A and of B.

4c
2 marks

Hence, solve f(x)<g(x).

5a
2 marks

A function is defined by f(x)=ex2+bx+4. The graph of f has an axis of symmetry x=2.

Find the value of b.

5b
1 mark

Write down the range of f.

5c
3 marks

Another function is defined by g(x)=−x2−255. The graphs of f and g intersect at the points A and B.

Find the equation of the line (AB). Give your answer in the form y=mx+c.

5d
2 marks

Find AB.

6a
2 marks

Consider the function f(x)=5−log10(6−4x). The line l1 intersects the graph of f at the points A(−1, y) and B(x, 5).

Find the value of x and the value of y.

6b
2 marks

Find the equation of l1. Give your answer in the form y=mx+c, where m and c are fractions.

6c
4 marks

The line l2 is the perpendicular bisector of [AB].

Find the equation of l2. Give your answer in the form ax+by+d=0, where a, b and d are integers.

7a
4 marks

The diagram below shows part of the graph of the function f(x)=5cos(12x−30)+6, where x is measured in degrees. The points A, B, C and D are stationary points. The points A, B, D and C are joined to form the quadrilateral ABDC.

q6a-2-2-very-hard-ib-ai-sl-maths

Write down the coordinates of

(i) A

(ii) B

(iii) C

(iv) D.

7b
2 marks

Find the area of the quadrilateral ABDC.

8a
2 marks

The intensity of light, I, is 100% at the surface of the ocean and decreases with depth. It can be modelled by the function

I(d)=k(1.08)−d

where I is a percentage, d is the depth below the surface, in metres, and k is a constant.

Find the value of k.

8b
3 marks

State the domain and range of I.

8c
4 marks

On a particularly bright day the intensity of light 6.2 m below the surface is 75%.

Calculate the percentage error in the model's estimate of the intensity at this depth.

9a
4 marks

The function f is defined by

f(x)={−x+5,−2≤x<2−4x+11,2≤x<32x−7,3≤x≤6

Draw the graph of f on the grid below.

q10a-2-2-very-hard-ib-ai-sl-maths
9b
3 marks

Find the values of x when f(x) = 0.

1a
4 marks

Let f(x)=e2cos(30x)+1, for x>0, where x is measured in degrees.

The nth minimum point on the graph of f has x-coordinate xn, where n∈ℤ+.

Given that xn=x1+(n−1)d, find x1 and d.

1b
4 marks

(i) Using sigma notation, write down an expression for x1+x2+x3+…+x16.

(ii) Find the value of the sum in part (b)(i). Give your answer to the nearest integer.

2a
4 marks

Let f(x)=2−5cos(30(3x−1)), for x>0, where x is measured in degrees.

The nth maximum point on the graph of f has x-coordinate xn, where n∈ℤ+.

Given that xn=x1+(n−1)d, find x1 and d.

2b
4 marks

(i) Using sigma notation, write down an expression for x1+x2+x3+…+x8.

(ii) Find the value of the sum in part (b)(i). Give your answer correct to two decimal places.