Linear Transformations of Data (DP IB Applications & Interpretation (AI)): Revision Note

Did this video help you?
Linear transformations of data
Why are linear transformations of data used?
Sometimes data might be very large or very small
You can apply a linear transformation to the data to make the values more manageable
You may have heard this referred to as:
Effects of constant changes
Linear coding
Linear transformations of data can affect the statistical measures
How is the mean affected by a linear transformation of data?
Let
format('truetype')%3Bfont-weight%3Anormal%3Bfont-style%3Anormal%3B%7D%3C%2Fstyle%3E%3C%2Fdefs%3E%3Ctext%20font-family%3D%22horizontalbf65417dcecc7f2b0006e%22%20font-size%3D%2213%22%20text-anchor%3D%22middle%22%20x%3D%223.5%22%20y%3D%2210%22%3E%26%23x23AF%3B%3C%2Ftext%3E%3Ctext%20font-family%3D%22horizontalbf65417dcecc7f2b0006e%22%20font-size%3D%2213%22%20text-anchor%3D%22middle%22%20x%3D%227.5%22%20y%3D%2210%22%3E%26%23x23AF%3B%3C%2Ftext%3E%3Ctext%20font-family%3D%22Times%20New%20Roman%22%20font-size%3D%2218%22%20font-style%3D%22italic%22%20text-anchor%3D%22middle%22%20x%3D%224.5%22%20y%3D%2218%22%3Ex%3C%2Ftext%3E%3C%2Fsvg%3E) be the mean of some data
be the mean of some dataIf you multiply each value by a constant k then you will need to multiply the mean by k
Mean is
format('truetype')%3Bfont-weight%3Anormal%3Bfont-style%3Anormal%3B%7D%3C%2Fstyle%3E%3C%2Fdefs%3E%3Ctext%20font-family%3D%22Times%20New%20Roman%22%20font-size%3D%2218%22%20font-style%3D%22italic%22%20text-anchor%3D%22middle%22%20x%3D%224.5%22%20y%3D%2218%22%3Ek%3C%2Ftext%3E%3Ctext%20font-family%3D%22horizontalbf65417dcecc7f2b0006e%22%20font-size%3D%2213%22%20text-anchor%3D%22middle%22%20x%3D%2213.5%22%20y%3D%2210%22%3E%26%23x23AF%3B%3C%2Ftext%3E%3Ctext%20font-family%3D%22horizontalbf65417dcecc7f2b0006e%22%20font-size%3D%2213%22%20text-anchor%3D%22middle%22%20x%3D%2217.5%22%20y%3D%2210%22%3E%26%23x23AF%3B%3C%2Ftext%3E%3Ctext%20font-family%3D%22Times%20New%20Roman%22%20font-size%3D%2218%22%20font-style%3D%22italic%22%20text-anchor%3D%22middle%22%20x%3D%2214.5%22%20y%3D%2218%22%3Ex%3C%2Ftext%3E%3C%2Fsvg%3E)
If you add or subtract a constant a to or from all the values then you will need to add or subtract the constant a to the mean
Mean is
format('truetype')%3Bfont-weight%3Anormal%3Bfont-style%3Anormal%3B%7D%40font-face%7Bfont-family%3A'math196da2f590cd7246bbde0051047'%3Bsrc%3Aurl(data%3Afont%2Ftruetype%3Bcharset%3Dutf-8%3Bbase64%2CAAEAAAAMAIAAAwBAT1MvMi7iBBMAAADMAAAATmNtYXDEvmKUAAABHAAAADRjdnQgDVUNBwAAAVAAAAA6Z2x5ZoPi2VsAAAGMAAAAxGhlYWQQC2qxAAACUAAAADZoaGVhCGsXSAAAAogAAAAkaG10eE2rRkcAAAKsAAAACGxvY2EAHTwYAAACtAAAAAxtYXhwBT0FPgAAAsAAAAAgbmFtZaBxlY4AAALgAAABn3Bvc3QB9wD6AAAEgAAAACBwcmVwa1uragAABKAAAAAUAAADSwGQAAUAAAQABAAAAAAABAAEAAAAAAAAAQEAAAAAAAAAAAAAAAAAAAAAAAAAAAAAAAAAAAAAACAgICAAAAAg1UADev96AAAD6ACWAAAAAAACAAEAAQAAABQAAwABAAAAFAAEACAAAAAEAAQAAQAAALH%2F%2FwAAALH%2F%2F%2F9QAAEAAAAAAAABVAMsAIABAABWACoCWAIeAQ4BLAIsAFoBgAKAAKAA1ACAAAAAAAAAACsAVQCAAKsA1QEAASsABwAAAAIAVQAAAwADqwADAAcAADMRIRElIREhVQKr%2FasCAP4AA6v8VVUDAAACAID%2F%2FwKAAqsACwAPAGUYAbAQELAP1LAPELAAPLAAELAB1LABELAE1LAEELAF1LABELAKPLAEELAHPLAFELAOPACwEBCwD9SwDxCwDNSwDBCwCdSwCRCwCtSwChCwAdSwARCwAtSwARCwBDywChCwBzwwMRMzNTMVMxUjFSMnBxEhFSGA1lXV1VUB1QIA%2FgAB1dbWVtTVAf7VVQABAAAAAQAA1XjOQV8PPPUAAwQA%2F%2F%2F%2F%2F9Y6E3P%2F%2F%2F%2F%2F1joTcwAA%2FyAEgAOrAAAACgACAAEAAAAAAAEAAAPo%2F2oAABdwAAD%2FtgSAAAEAAAAAAAAAAAAAAAAAAAACA1IAVQMAAIAAAAAAAAAAKAAAAMQAAQAAAAIAXgAFAAAAAAACAIAEAAAAAAAEAADeAAAAAAAAABUBAgAAAAAAAAABABIAAAAAAAAAAAACAA4AEgAAAAAAAAADADAAIAAAAAAAAAAEABIAUAAAAAAAAAAFABYAYgAAAAAAAAAGAAkAeAAAAAAAAAAIABwAgQABAAAAAAABABIAAAABAAAAAAACAA4AEgABAAAAAAADADAAIAABAAAAAAAEABIAUAABAAAAAAAFABYAYgABAAAAAAAGAAkAeAABAAAAAAAIABwAgQADAAEECQABABIAAAADAAEECQACAA4AEgADAAEECQADADAAIAADAAEECQAEABIAUAADAAEECQAFABYAYgADAAEECQAGAAkAeAADAAEECQAIABwAgQBNAGEAdABoACAARgBvAG4AdABSAGUAZwB1AGwAYQByAE0AYQB0AGgAcwAgAEYAbwByACAATQBvAHIAZQAgAE0AYQB0AGgAIABGAG8AbgB0AE0AYQB0AGgAIABGAG8AbgB0AFYAZQByAHMAaQBvAG4AIAAxAC4AME1hdGhfRm9udABNAGEAdABoAHMAIABGAG8AcgAgAE0AbwByAGUAAAMAAAAAAAAB9AD6AAAAAAAAAAAAAAAAAAAAAAAAAAC5BxEAAI2FGACyAAAAFRQTsQABPw%3D%3D)format('truetype')%3Bfont-weight%3Anormal%3Bfont-style%3Anormal%3B%7D%3C%2Fstyle%3E%3C%2Fdefs%3E%3Ctext%20font-family%3D%22horizontalbf65417dcecc7f2b0006e%22%20font-size%3D%2213%22%20text-anchor%3D%22middle%22%20x%3D%223.5%22%20y%3D%2210%22%3E%26%23x23AF%3B%3C%2Ftext%3E%3Ctext%20font-family%3D%22horizontalbf65417dcecc7f2b0006e%22%20font-size%3D%2213%22%20text-anchor%3D%22middle%22%20x%3D%227.5%22%20y%3D%2210%22%3E%26%23x23AF%3B%3C%2Ftext%3E%3Ctext%20font-family%3D%22Times%20New%20Roman%22%20font-size%3D%2218%22%20font-style%3D%22italic%22%20text-anchor%3D%22middle%22%20x%3D%224.5%22%20y%3D%2218%22%3Ex%3C%2Ftext%3E%3Ctext%20font-family%3D%22math196da2f590cd7246bbde0051047%22%20font-size%3D%2216%22%20text-anchor%3D%22middle%22%20x%3D%2218.5%22%20y%3D%2218%22%3E%26%23xB1%3B%3C%2Ftext%3E%3Ctext%20font-family%3D%22Times%20New%20Roman%22%20font-size%3D%2218%22%20font-style%3D%22italic%22%20text-anchor%3D%22middle%22%20x%3D%2230.5%22%20y%3D%2218%22%3Ea%3C%2Ftext%3E%3C%2Fsvg%3E)
How is the variance and standard deviation affected by a linear transformation of data?
Let
 be the variance of some data
 is the standard deviation
If you multiply each value by a constant k then you will need to multiply the variance by k²
Variance is

You will need to multiply the standard deviation by the absolute value of k
Standard deviation is
format('truetype')%3Bfont-weight%3Anormal%3Bfont-style%3Anormal%3B%7D%3C%2Fstyle%3E%3C%2Fdefs%3E%3Ctext%20font-family%3D%22brack_sm47dfc8ff4929ef7202a7f1c%22%20font-size%3D%2218%22%20text-anchor%3D%22start%22%20x%3D%221.5%22%20y%3D%228%22%3E%26%23xF402%3B%3C%2Ftext%3E%3Ctext%20font-family%3D%22brack_sm47dfc8ff4929ef7202a7f1c%22%20font-size%3D%2218%22%20text-anchor%3D%22start%22%20x%3D%221.5%22%20y%3D%2214%22%3E%26%23xF402%3B%3C%2Ftext%3E%3Ctext%20font-family%3D%22brack_sm47dfc8ff4929ef7202a7f1c%22%20font-size%3D%2218%22%20text-anchor%3D%22start%22%20x%3D%221.5%22%20y%3D%2220%22%3E%26%23xF402%3B%3C%2Ftext%3E%3Ctext%20font-family%3D%22brack_sm47dfc8ff4929ef7202a7f1c%22%20font-size%3D%2218%22%20text-anchor%3D%22start%22%20x%3D%2217.5%22%20y%3D%228%22%3E%26%23xF402%3B%3C%2Ftext%3E%3Ctext%20font-family%3D%22brack_sm47dfc8ff4929ef7202a7f1c%22%20font-size%3D%2218%22%20text-anchor%3D%22start%22%20x%3D%2217.5%22%20y%3D%2214%22%3E%26%23xF402%3B%3C%2Ftext%3E%3Ctext%20font-family%3D%22brack_sm47dfc8ff4929ef7202a7f1c%22%20font-size%3D%2218%22%20text-anchor%3D%22start%22%20x%3D%2217.5%22%20y%3D%2220%22%3E%26%23xF402%3B%3C%2Ftext%3E%3Ctext%20font-family%3D%22Times%20New%20Roman%22%20font-size%3D%2218%22%20font-style%3D%22italic%22%20text-anchor%3D%22middle%22%20x%3D%2210.5%22%20y%3D%2216%22%3Ek%3C%2Ftext%3E%3Ctext%20font-family%3D%22Times%20New%20Roman%22%20font-size%3D%2218%22%20font-style%3D%22italic%22%20text-anchor%3D%22middle%22%20x%3D%2227.5%22%20y%3D%2216%22%3E%26%23x3C3%3B%3C%2Ftext%3E%3C%2Fsvg%3E)
If you add or subtract a constant a from all the values then the variance and the standard deviation stay the same
Variance is
Standard deviation is
Examiner Tips and Tricks
If you forget these results in an exam then you can look in the HL section of the formula booklet to see them written in a more algebraic way:
Linear transformation of a single variable
%3C%2Fmo%3E%3C%2Fmrow%3E%3C%2Fmtd%3E%3Cmtd%3E%3Cmo%3E%3D%3C%2Fmo%3E%3C%2Fmtd%3E%3Cmtd%3E%3Cmrow%3E%3Cmi%3Ea%3C%2Fmi%3E%3Cmi%20mathvariant%3D%22normal%22%3EE%3C%2Fmi%3E%3Cmo%3E(%3C%2Fmo%3E%3Cmi%3EX%3C%2Fmi%3E%3Cmo%3E)%3C%2Fmo%3E%3Cmo%3E%2B%3C%2Fmo%3E%3Cmi%3Eb%3C%2Fmi%3E%3C%2Fmrow%3E%3C%2Fmtd%3E%3C%2Fmtr%3E%3Cmtr%3E%3Cmtd%3E%3Cmrow%3E%3Cmi%3EVar%3C%2Fmi%3E%3Cmo%3E(%3C%2Fmo%3E%3Cmi%3Ea%3C%2Fmi%3E%3Cmi%3EX%3C%2Fmi%3E%3Cmo%3E%2B%3C%2Fmo%3E%3Cmi%3Eb%3C%2Fmi%3E%3Cmo%3E)%3C%2Fmo%3E%3C%2Fmrow%3E%3C%2Fmtd%3E%3Cmtd%3E%3Cmo%3E%3D%3C%2Fmo%3E%3C%2Fmtd%3E%3Cmtd%3E%3Cmrow%3E%3Cmsup%3E%3Cmi%3Ea%3C%2Fmi%3E%3Cmn%3E2%3C%2Fmn%3E%3C%2Fmsup%3E%3Cmi%3EVar%3C%2Fmi%3E%3Cmo%3E(%3C%2Fmo%3E%3Cmi%3EX%3C%2Fmi%3E%3Cmo%3E)%3C%2Fmo%3E%3C%2Fmrow%3E%3C%2Fmtd%3E%3C%2Fmtr%3E%3C%2Fmtable%3E%3C%2Fmath%3E--%3E%3Cdefs%3E%3Cstyle%20type%3D%22text%2Fcss%22%3E%40font-face%7Bfont-family%3A'math12ed72e0d2d50af08c235c494fe'%3Bsrc%3Aurl(data%3Afont%2Ftruetype%3Bcharset%3Dutf-8%3Bbase64%2CAAEAAAAMAIAAAwBAT1MvMi7iBBMAAADMAAAATmNtYXDEvmKUAAABHAAAADxjdnQgDVUNBwAAAVgAAAA6Z2x5ZoPi2VsAAAGUAAABK2hlYWQQC2qxAAACwAAAADZoaGVhCGsXSAAAAvgAAAAkaG10eE2rRkcAAAMcAAAADGxvY2EAHTwYAAADKAAAABBtYXhwBT0FPgAAAzgAAAAgbmFtZaBxlY4AAANYAAABn3Bvc3QB9wD6AAAE%2BAAAACBwcmVwa1uragAABRgAAAAUAAADSwGQAAUAAAQABAAAAAAABAAEAAAAAAAAAQEAAAAAAAAAAAAAAAAAAAAAAAAAAAAAAAAAAAAAACAgICAAAAAg1UADev96AAAD6ACWAAAAAAACAAEAAQAAABQAAwABAAAAFAAEACgAAAAGAAQAAQACACsAPf%2F%2FAAAAKwA9%2F%2F%2F%2F1v%2FFAAEAAAAAAAAAAAFUAywAgAEAAFYAKgJYAh4BDgEsAiwAWgGAAoAAoADUAIAAAAAAAAAAKwBVAIAAqwDVAQABKwAHAAAAAgBVAAADAAOrAAMABwAAMxEhESUhESFVAqv9qwIA%2FgADq%2FxVVQMAAAEAgABVAtUCqwALAEkBGLIMAQEUExCxAAP2sQEE9bAKPLEDBfWwCDyxBQT1sAY8sQ0D5gCxAAATELEBBuSxAQETELAFPLEDBOWxCwX1sAc8sQkE5TEwEyERMxEhFSERIxEhgAEAVQEA%2FwBV%2FwABqwEA%2FwBW%2FwABAAACAIAA6wLVAhUAAwAHAGUYAbAIELAG1LAGELAF1LAIELAB1LABELAA1LAGELAHPLAFELAEPLABELACPLAAELADPACwCBCwBtSwBhCwB9SwBxCwAdSwARCwAtSwBhCwBTywBxCwBDywARCwADywAhCwAzwxMBMhNSEdASE1gAJV%2FasCVQHAVdVVVQAAAQAAAAEAANV4zkFfDzz1AAMEAP%2F%2F%2F%2F%2FWOhNz%2F%2F%2F%2F%2F9Y6E3MAAP8gBIADqwAAAAoAAgABAAAAAAABAAAD6P9qAAAXcAAA%2F7YEgAABAAAAAAAAAAAAAAAAAAAAAwNSAFUDVgCAA1YAgAAAAAAAAAAoAAAAoQAAASsAAQAAAAMAXgAFAAAAAAACAIAEAAAAAAAEAADeAAAAAAAAABUBAgAAAAAAAAABABIAAAAAAAAAAAACAA4AEgAAAAAAAAADADAAIAAAAAAAAAAEABIAUAAAAAAAAAAFABYAYgAAAAAAAAAGAAkAeAAAAAAAAAAIABwAgQABAAAAAAABABIAAAABAAAAAAACAA4AEgABAAAAAAADADAAIAABAAAAAAAEABIAUAABAAAAAAAFABYAYgABAAAAAAAGAAkAeAABAAAAAAAIABwAgQADAAEECQABABIAAAADAAEECQACAA4AEgADAAEECQADADAAIAADAAEECQAEABIAUAADAAEECQAFABYAYgADAAEECQAGAAkAeAADAAEECQAIABwAgQBNAGEAdABoACAARgBvAG4AdABSAGUAZwB1AGwAYQByAE0AYQB0AGgAcwAgAEYAbwByACAATQBvAHIAZQAgAE0AYQB0AGgAIABGAG8AbgB0AE0AYQB0AGgAIABGAG8AbgB0AFYAZQByAHMAaQBvAG4AIAAxAC4AME1hdGhfRm9udABNAGEAdABoAHMAIABGAG8AcgAgAE0AbwByAGUAAAMAAAAAAAAB9AD6AAAAAAAAAAAAAAAAAAAAAAAAAAC5BxEAAI2FGACyAAAAFRQTsQABPw%3D%3D)format('truetype')%3Bfont-weight%3Anormal%3Bfont-style%3Anormal%3B%7D%40font-face%7Bfont-family%3A'round_brackets18549f92a457f2409'%3Bsrc%3Aurl(data%3Afont%2Ftruetype%3Bcharset%3Dutf-8%3Bbase64%2CAAEAAAAMAIAAAwBAT1MvMjwHLFQAAADMAAAATmNtYXDf7xCrAAABHAAAADxjdnQgBAkDLgAAAVgAAAASZ2x5ZmAOz2cAAAFsAAABJGhlYWQOKih8AAACkAAAADZoaGVhCvgVwgAAAsgAAAAkaG10eCA6AAIAAALsAAAADGxvY2EAAARLAAAC%2BAAAABBtYXhwBIgEWQAAAwgAAAAgbmFtZXHR30MAAAMoAAACOXBvc3QDogHPAAAFZAAAACBwcmVwupWEAAAABYQAAAAHAAAGcgGQAAUAAAgACAAAAAAACAAIAAAAAAAAAQIAAAAAAAAAAAAAAAAAAAAAAAAAAAAAAAAAAAAAACAgICAAAAAo8AMGe%2F57AAAHPgGyAAAAAAACAAEAAQAAABQAAwABAAAAFAAEACgAAAAGAAQAAQACACgAKf%2F%2FAAAAKAAp%2F%2F%2F%2F2f%2FZAAEAAAAAAAAAAAFUAFYBAAAsAKgDgAAyAAcAAAACAAAAKgDVA1UAAwAHAAA1MxEjEyMRM9XVq4CAKgMr%2FQAC1QABAAD%2B0AIgBtAACQBNGAGwChCwA9SwAxCwAtSwChCwBdSwBRCwANSwAxCwBzywAhCwCDwAsAoQsAPUsAMQsAfUsAoQsAXUsAoQsADUsAMQsAI8sAcQsAg8MTAREAEzABEQASMAAZCQ%2FnABkJD%2BcALQ%2FZD%2BcAGQAnACcAGQ%2FnAAAQAA%2FtACIAbQAAkATRgBsAoQsAPUsAMQsALUsAoQsAXUsAUQsADUsAMQsAc8sAIQsAg8ALAKELAD1LADELAH1LAKELAF1LAKELAA1LADELACPLAHELAIPDEwARABIwAREAEzAAIg%2FnCQAZD%2BcJABkALQ%2FZD%2BcAGQAnACcAGQ%2FnAAAQAAAAEAAPW2NYFfDzz1AAMIAP%2F%2F%2F%2F%2FVre7u%2F%2F%2F%2F%2F9Wt7u4AAP7QA7cG0AAAAAoAAgABAAAAAAABAAAHPv5OAAAXcAAA%2F%2F4DtwABAAAAAAAAAAAAAAAAAAAAAwDVAAACIAAAAiAAAAAAAAAAAAAkAAAAowAAASQAAQAAAAMACgACAAAAAAACAIAEAAAAAAAEAABNAAAAAAAAABUBAgAAAAAAAAABAD4AAAAAAAAAAAACAA4APgAAAAAAAAADAFwATAAAAAAAAAAEAD4AqAAAAAAAAAAFABYA5gAAAAAAAAAGAB8A%2FAAAAAAAAAAIABwBGwABAAAAAAABAD4AAAABAAAAAAACAA4APgABAAAAAAADAFwATAABAAAAAAAEAD4AqAABAAAAAAAFABYA5gABAAAAAAAGAB8A%2FAABAAAAAAAIABwBGwADAAEECQABAD4AAAADAAEECQACAA4APgADAAEECQADAFwATAADAAEECQAEAD4AqAADAAEECQAFABYA5gADAAEECQAGAB8A%2FAADAAEECQAIABwBGwBSAG8AdQBuAGQAIABiAHIAYQBjAGsAZQB0AHMAIAB3AGkAdABoACAAYQBzAGMAZQBuAHQAIAAxADgANQA0AFIAZQBnAHUAbABhAHIATQBhAHQAaABzACAARgBvAHIAIABNAG8AcgBlACAAUgBvAHUAbgBkACAAYgByAGEAYwBrAGUAdABzACAAdwBpAHQAaAAgAGEAcwBjAGUAbgB0ACAAMQA4ADUANABSAG8AdQBuAGQAIABiAHIAYQBjAGsAZQB0AHMAIAB3AGkAdABoACAAYQBzAGMAZQBuAHQAIAAxADgANQA0AFYAZQByAHMAaQBvAG4AIAAyAC4AMFJvdW5kX2JyYWNrZXRzX3dpdGhfYXNjZW50XzE4NTQATQBhAHQAaABzACAARgBvAHIAIABNAG8AcgBlAAAAAAMAAAAAAAADnwHPAAAAAAAAAAAAAAAAAAAAAAAAAAC5B%2F8AAY2FAA%3D%3D)format('truetype')%3Bfont-weight%3Anormal%3Bfont-style%3Anormal%3B%7D%3C%2Fstyle%3E%3C%2Fdefs%3E%3Ctext%20fill%3D%22%23000%22%20font-family%3D%22Times%20New%20Roman%22%20font-size%3D%2220%22%20text-anchor%3D%22middle%22%20x%3D%2224.5%22%20y%3D%2218%22%3EE%3C%2Ftext%3E%3Ctext%20fill%3D%22%23000%22%20font-family%3D%22round_brackets18549f92a457f2409%22%20font-size%3D%2220%22%20text-anchor%3D%22middle%22%20x%3D%2234.5%22%20y%3D%2218%22%3E(%3C%2Ftext%3E%3Ctext%20fill%3D%22%23000%22%20font-family%3D%22Times%20New%20Roman%22%20font-size%3D%2220%22%20font-style%3D%22italic%22%20text-anchor%3D%22middle%22%20x%3D%2241.5%22%20y%3D%2218%22%3Ea%3C%2Ftext%3E%3Ctext%20fill%3D%22%23000%22%20font-family%3D%22Times%20New%20Roman%22%20font-size%3D%2220%22%20font-style%3D%22italic%22%20text-anchor%3D%22middle%22%20x%3D%2253.5%22%20y%3D%2218%22%3EX%3C%2Ftext%3E%3Ctext%20fill%3D%22%23000%22%20font-family%3D%22math12ed72e0d2d50af08c235c494fe%22%20font-size%3D%2217%22%20text-anchor%3D%22middle%22%20x%3D%2270.5%22%20y%3D%2218%22%3E%2B%3C%2Ftext%3E%3Ctext%20fill%3D%22%23000%22%20font-family%3D%22Times%20New%20Roman%22%20font-size%3D%2220%22%20font-style%3D%22italic%22%20text-anchor%3D%22middle%22%20x%3D%2284.5%22%20y%3D%2218%22%3Eb%3C%2Ftext%3E%3Ctext%20fill%3D%22%23000%22%20font-family%3D%22round_brackets18549f92a457f2409%22%20font-size%3D%2220%22%20text-anchor%3D%22middle%22%20x%3D%2292.5%22%20y%3D%2218%22%3E)%3C%2Ftext%3E%3Ctext%20fill%3D%22%23000%22%20font-family%3D%22math12ed72e0d2d50af08c235c494fe%22%20font-size%3D%2217%22%20text-anchor%3D%22middle%22%20x%3D%22106.5%22%20y%3D%2218%22%3E%3D%3C%2Ftext%3E%3Ctext%20fill%3D%22%23000%22%20font-family%3D%22Times%20New%20Roman%22%20font-size%3D%2220%22%20font-style%3D%22italic%22%20text-anchor%3D%22middle%22%20x%3D%22119.5%22%20y%3D%2218%22%3Ea%3C%2Ftext%3E%3Ctext%20fill%3D%22%23000%22%20font-family%3D%22Times%20New%20Roman%22%20font-size%3D%2220%22%20text-anchor%3D%22middle%22%20x%3D%22131.5%22%20y%3D%2218%22%3EE%3C%2Ftext%3E%3Ctext%20fill%3D%22%23000%22%20font-family%3D%22round_brackets18549f92a457f2409%22%20font-size%3D%2220%22%20text-anchor%3D%22middle%22%20x%3D%22141.5%22%20y%3D%2218%22%3E(%3C%2Ftext%3E%3Ctext%20fill%3D%22%23000%22%20font-family%3D%22Times%20New%20Roman%22%20font-size%3D%2220%22%20font-style%3D%22italic%22%20text-anchor%3D%22middle%22%20x%3D%22151.5%22%20y%3D%2218%22%3EX%3C%2Ftext%3E%3Ctext%20fill%3D%22%23000%22%20font-family%3D%22round_brackets18549f92a457f2409%22%20font-size%3D%2220%22%20text-anchor%3D%22middle%22%20x%3D%22161.5%22%20y%3D%2218%22%3E)%3C%2Ftext%3E%3Ctext%20fill%3D%22%23000%22%20font-family%3D%22math12ed72e0d2d50af08c235c494fe%22%20font-size%3D%2217%22%20text-anchor%3D%22middle%22%20x%3D%22175.5%22%20y%3D%2218%22%3E%2B%3C%2Ftext%3E%3Ctext%20fill%3D%22%23000%22%20font-family%3D%22Times%20New%20Roman%22%20font-size%3D%2220%22%20font-style%3D%22italic%22%20text-anchor%3D%22middle%22%20x%3D%22189.5%22%20y%3D%2218%22%3Eb%3C%2Ftext%3E%3Ctext%20fill%3D%22%23000%22%20font-family%3D%22Times%20New%20Roman%22%20font-size%3D%2220%22%20text-anchor%3D%22middle%22%20x%3D%2215.5%22%20y%3D%2249%22%3EVar%3C%2Ftext%3E%3Ctext%20fill%3D%22%23000%22%20font-family%3D%22round_brackets18549f92a457f2409%22%20font-size%3D%2220%22%20text-anchor%3D%22middle%22%20x%3D%2234.5%22%20y%3D%2249%22%3E(%3C%2Ftext%3E%3Ctext%20fill%3D%22%23000%22%20font-family%3D%22Times%20New%20Roman%22%20font-size%3D%2220%22%20font-style%3D%22italic%22%20text-anchor%3D%22middle%22%20x%3D%2241.5%22%20y%3D%2249%22%3Ea%3C%2Ftext%3E%3Ctext%20fill%3D%22%23000%22%20font-family%3D%22Times%20New%20Roman%22%20font-size%3D%2220%22%20font-style%3D%22italic%22%20text-anchor%3D%22middle%22%20x%3D%2253.5%22%20y%3D%2249%22%3EX%3C%2Ftext%3E%3Ctext%20fill%3D%22%23000%22%20font-family%3D%22math12ed72e0d2d50af08c235c494fe%22%20font-size%3D%2217%22%20text-anchor%3D%22middle%22%20x%3D%2270.5%22%20y%3D%2249%22%3E%2B%3C%2Ftext%3E%3Ctext%20fill%3D%22%23000%22%20font-family%3D%22Times%20New%20Roman%22%20font-size%3D%2220%22%20font-style%3D%22italic%22%20text-anchor%3D%22middle%22%20x%3D%2284.5%22%20y%3D%2249%22%3Eb%3C%2Ftext%3E%3Ctext%20fill%3D%22%23000%22%20font-family%3D%22round_brackets18549f92a457f2409%22%20font-size%3D%2220%22%20text-anchor%3D%22middle%22%20x%3D%2292.5%22%20y%3D%2249%22%3E)%3C%2Ftext%3E%3Ctext%20fill%3D%22%23000%22%20font-family%3D%22math12ed72e0d2d50af08c235c494fe%22%20font-size%3D%2217%22%20text-anchor%3D%22middle%22%20x%3D%22106.5%22%20y%3D%2249%22%3E%3D%3C%2Ftext%3E%3Ctext%20fill%3D%22%23000%22%20font-family%3D%22Times%20New%20Roman%22%20font-size%3D%2220%22%20font-style%3D%22italic%22%20text-anchor%3D%22middle%22%20x%3D%22119.5%22%20y%3D%2249%22%3Ea%3C%2Ftext%3E%3Ctext%20fill%3D%22%23000%22%20font-family%3D%22Times%20New%20Roman%22%20font-size%3D%2215%22%20text-anchor%3D%22middle%22%20x%3D%22129.5%22%20y%3D%2243%22%3E2%3C%2Ftext%3E%3Ctext%20fill%3D%22%23000%22%20font-family%3D%22Times%20New%20Roman%22%20font-size%3D%2220%22%20text-anchor%3D%22middle%22%20x%3D%22148.5%22%20y%3D%2249%22%3EVar%3C%2Ftext%3E%3Ctext%20fill%3D%22%23000%22%20font-family%3D%22round_brackets18549f92a457f2409%22%20font-size%3D%2220%22%20text-anchor%3D%22middle%22%20x%3D%22167.5%22%20y%3D%2249%22%3E(%3C%2Ftext%3E%3Ctext%20fill%3D%22%23000%22%20font-family%3D%22Times%20New%20Roman%22%20font-size%3D%2220%22%20font-style%3D%22italic%22%20text-anchor%3D%22middle%22%20x%3D%22177.5%22%20y%3D%2249%22%3EX%3C%2Ftext%3E%3Ctext%20fill%3D%22%23000%22%20font-family%3D%22round_brackets18549f92a457f2409%22%20font-size%3D%2220%22%20text-anchor%3D%22middle%22%20x%3D%22187.5%22%20y%3D%2249%22%3E)%3C%2Ftext%3E%3C%2Fsvg%3E)
where E(...) means the mean and Var(...) means the variance.
Worked Example
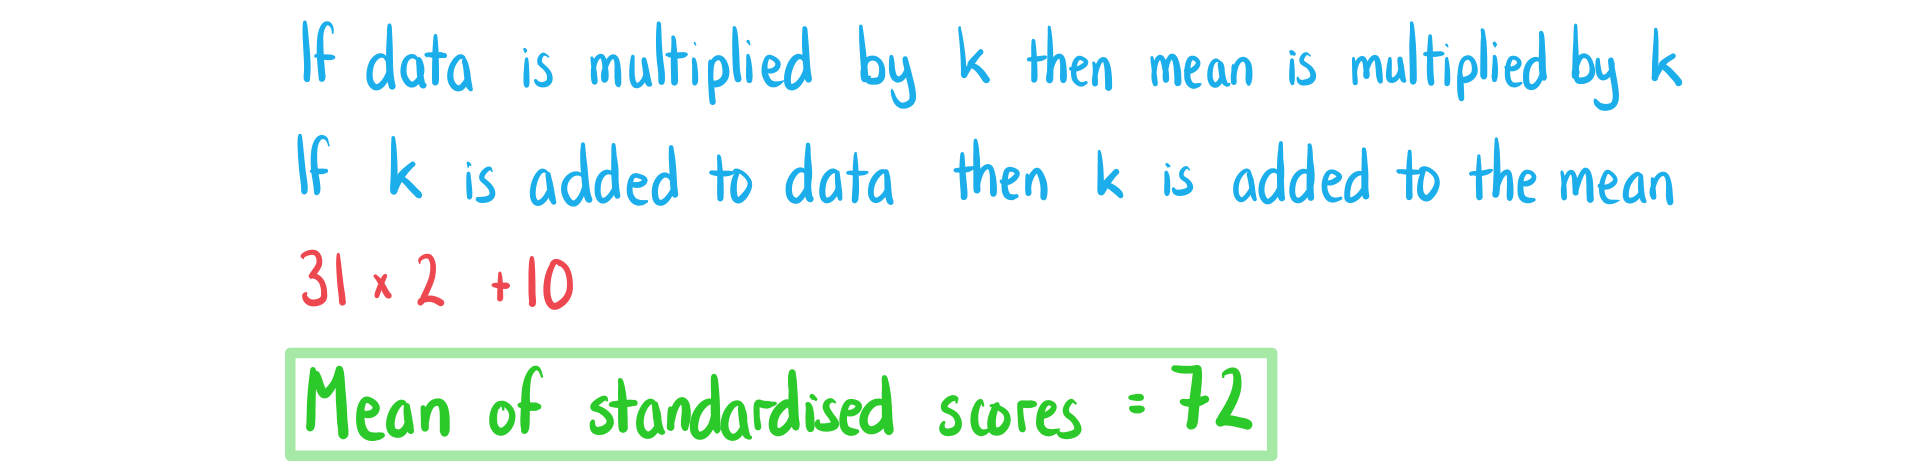
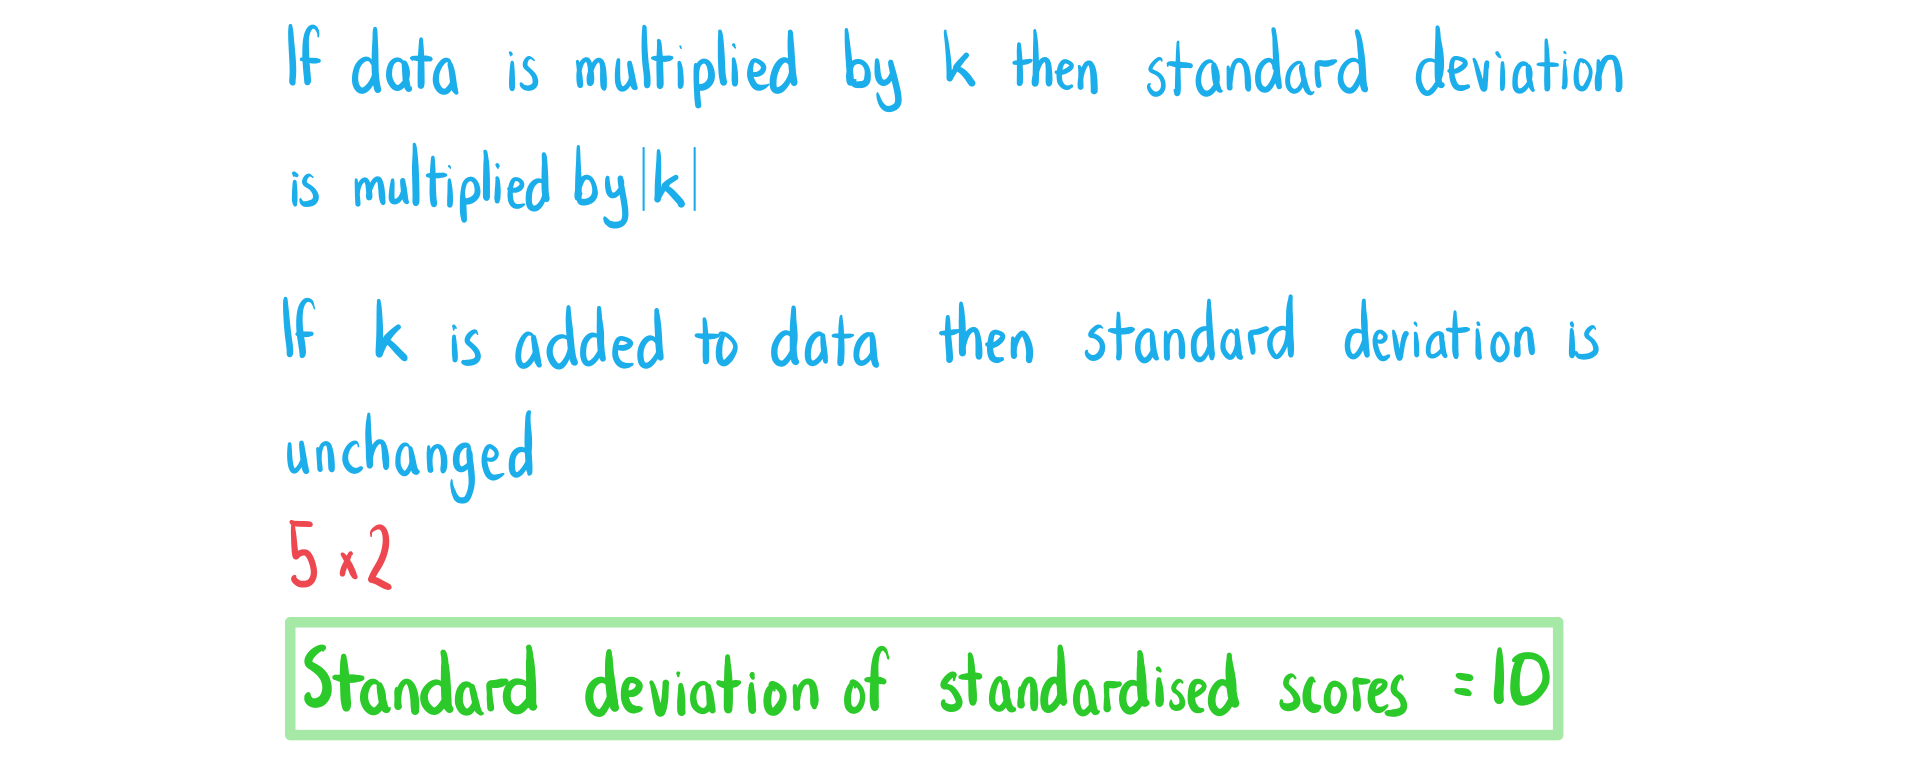
A teacher marks his students’ tests. The raw mean score is 31 marks and the standard deviation is 5 marks. The teacher standardises the score by doubling the raw score and then adding 10.
a) Calculate the mean standardised score.
Answer:
b) Calculate the standard deviation of the standardised scores.
Answer:

Unlock more, it's free!
Join the 100,000+ Students that ❤️ Save My Exams
the (exam) results speak for themselves:

Was this revision note helpful?
