Correlations (OCR GCSE Psychology): Revision Note
Exam code: J203

What is a correlation?
A correlation is not a research method but a way of analysing data to see if there is a relationship between two co-variables
Unlike experiments, no variables are manipulated — instead, both are measured and compared to see if changes in one are linked to changes in the other
Correlations use quantitative data, which can come from questionnaires, observations, or pre-existing records
Co-variables
The two variables being measured are called co-variables
Neither is an IV or DV—both are measured as they naturally occur or are pre-existing, e.g.
School attendance measured as days present at school in Year 11 (co-variable) and number of GCSEs achieved (co-variable)
Average temperature in August (co-variable) and number of arrests made for violent behaviour in August in one town
One or both of the co-variables could be measured for the research itself, e.g.
Number of takeaway meals consumed in a month (co-variable) and self-reported stress levels for the same month (co-variable)
Average number of hours slept in one week (co-variable) and number of cups of caffeinated beverages consumed in the same week (co-variable)
Each participant or data point provides two scores, one for each co-variable (e.g. hours of sleep and stress score)
Examiner Tips and Tricks
You may be asked to plot the points on a scatter diagram in the exam, so make sure that you have done this a few times before the exam (make up your own data; you don’t need to go searching for past questions).
Types of correlation & scatter diagrams
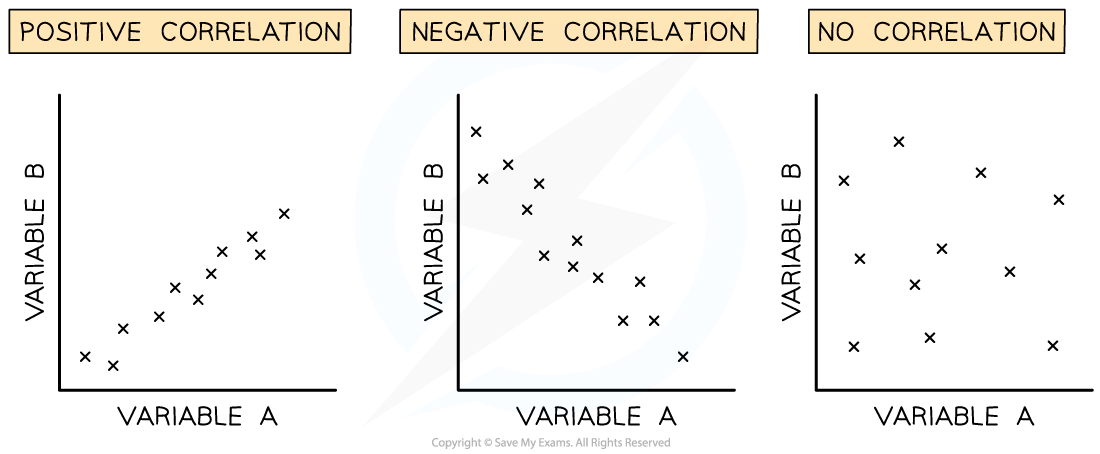
There are three types of correlation:
Positive correlation: As one variable increases, so does the other, e.g. calories consumed and weight gained
Negative correlation: As one variable increases, the other decreases, e.g. hours spent watching television and level of fitness
Zero correlation: There is no relationship between the variables e.g. hair colour and IQ
Correlations are shown on scatter diagrams, with one dot per participant
The direction of the line of best fit shows the type of correlation
Correlation coefficient
A numerical value that shows the strength and direction of a correlation, ranging from: –1 to +1
+1 = perfect positive correlation
–1 = perfect negative correlation
0 = no relationship
Both positive and negative correlations can be weak, moderate, or strong, depending on how close the value is to ±1
E.g. a correlation coefficient of 0.2 is a weak positive correlation; a correlation coefficient of -0.8 is a strong negative correlation
Evaluation of correlations
Strengths
Correlations identify relationships between variables that can be explored further through experiments
They allow analysis of existing data quickly, often without needing new data collection
Correlations are useful when manipulating variables would be unethical (e.g. studying links between stress and illness)
Weaknesses
Correlations cannot show cause and effect — we can’t tell which variable causes the change
Other variables may influence the results (e.g. illness could affect both attendance and grades)
Use only quantitative data, which may lack depth or validity
Examiner Tips and Tricks
Students sometimes mix up correlations and experiments. Remember—correlations measure two variables to see if there’s a relationship between them.
In an experiment, there’s an IV (which is changed) and a DV (which is measured), allowing researchers to test for cause and effect. Correlations can only show relationships, not causes and effects.

Unlock more, it's free!
Join the 100,000+ Students that ❤️ Save My Exams
the (exam) results speak for themselves:

Was this revision note helpful?