Syllabus Edition

First teaching 2025

First exams 2027

Population Change (Cambridge (CIE) IGCSE Geography): Exam Questions

Exam code: 0460 & 0976

14 mins3 questions
1a1 mark

Insert the following words into the equation to show how overall population change is calculated.

  • death rate

  • migration

  • birth rate

..................... - ....................... + or - .................... = overall population change

1b2 marks

Use Figure 2.1 to state the average annual rate of population change between 2015 and 2020 of the following countries.

World map showing average annual population change (2015-2020). Various shades indicate rates from -1% to 5%, with highest in Africa, no data in white.

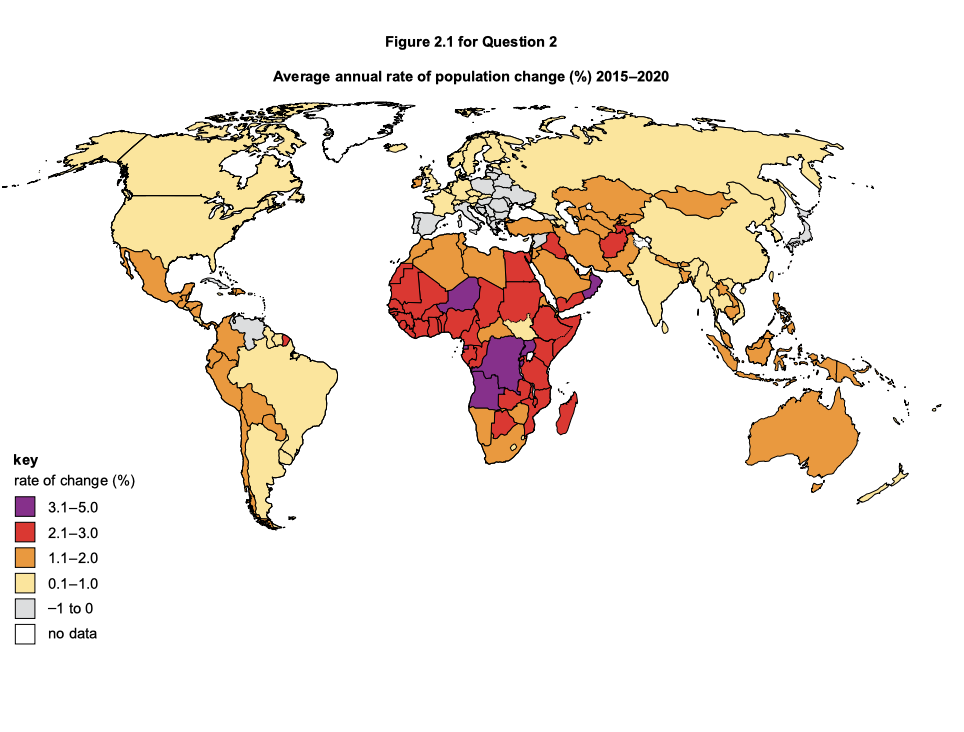
Angola ............................................................%

USA ............................................................%

1c3 marks

Use Figure 2.1 to compare the rates of population change in Africa and Europe.

23 marks

Figure 2.2 shows information about birth rates and death rates in China between 1962 and 2020

Graph showing birth and death rates per 1000 people from 1962 to 2020. Birth rate declines sharply; death rate remains steady. One-child policy indicated.

Which of the following statements are true about birth rates and death rates in China during the period shown in Figure 2.2?

Choose three answers.

The birth rate has always been higher than the death rate.

Both the birth rate and the death rate declined overall.

Natural population growth increased overall.

The birth rate has fluctuated more than the death rate.

The death rate has declined every year.

The death rate was higher than the birth rate in 2020.

15 marks

The one-child policy was a strategy used by the government of China to influence natural population growth rates.

Use Figure 2.2 to evaluate the impacts of the one-child policy on population growth in China.

Graph showing birth and death rates per 1000 people in China from 1962 to 2020, highlighting the impact of the one-child policy starting in 1980.