1a
1 mark
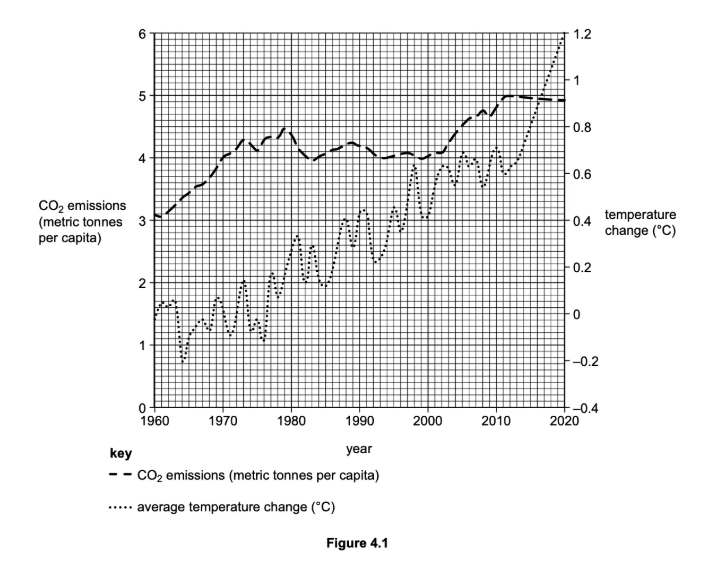
Study Figure 4.1, which shows changes in global carbon dioxide (CO2) emissions and average temperature change between 1960 and 2020.
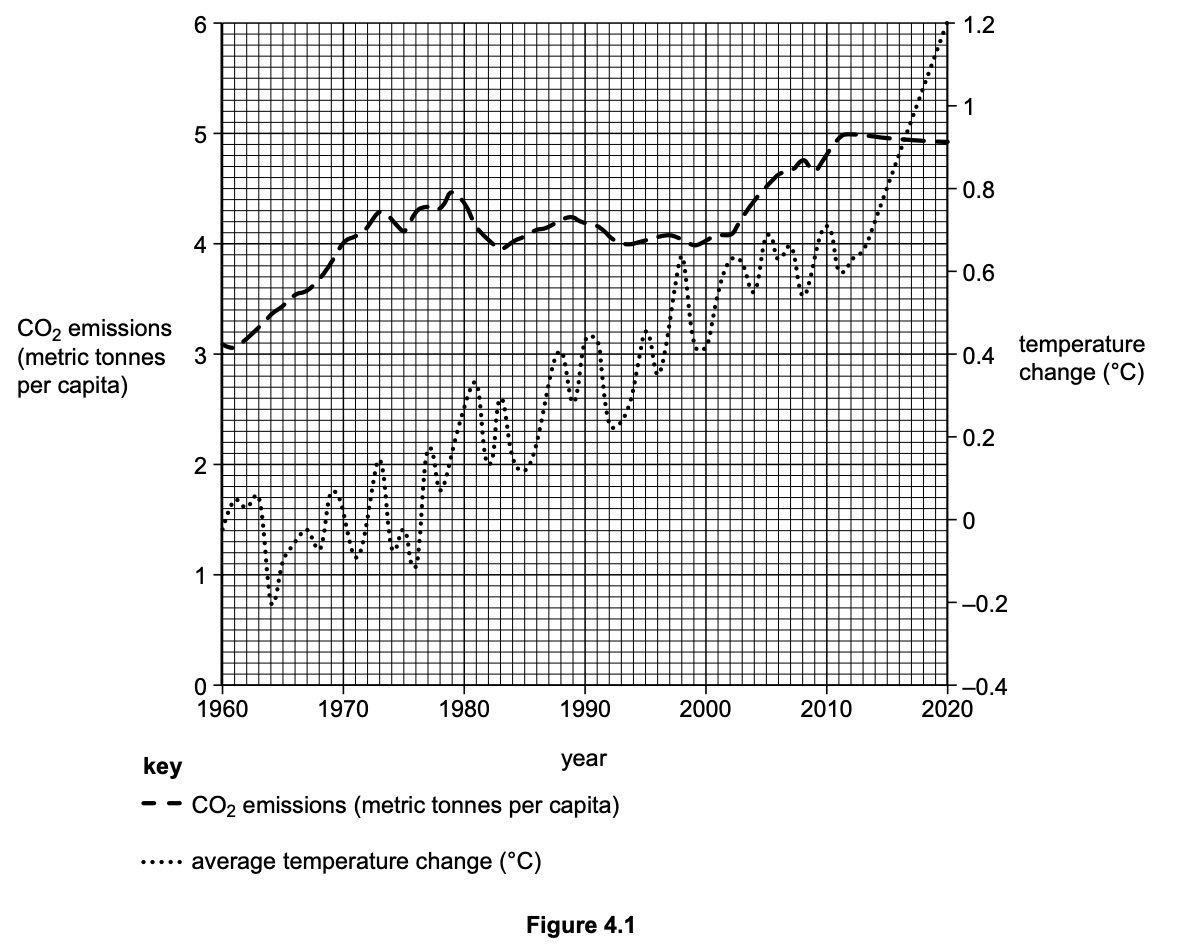
Estimate the increase in global CO2 emissions between 1960 and 2020.
1b
2 marks
Give two reasons for the increase in global CO2 emissions between 1960 and 2020.
1c
3 marks
Use Figure 4.1 to describe the average changes in temperature between 1960 and 2020. Refer to data in your answer.
Was this exam question helpful?