Abiotic & Biotic Factors (Edexcel IGCSE Science (Double Award): Biology): Revision Note
Exam code: 4SD0

Abiotic & Biotic Factors
An abiotic factor is a non-living factor within an environment
e.g. temperature, light intensity and wind speed
How abiotic factors affect population size and distribution
Abiotic factor | How abiotic factor affects community | Example |
|---|---|---|
Light intensity | Light is needed for photosynthesis. If light levels are low, plants grow more slowly and produce less food for herbivores. This can affect the entire food chain | In dense forests, only shade-tolerant plants can survive on the darker forest floor, while sun-loving plants grow in open areas or at the canopy level. |
Temperature | Temperature affects the rate of enzyme-controlled reactions in organisms. If it’s too cold or too hot, enzymes don’t work efficiently, which reduces survival and reproduction rates. | Polar bears are adapted to cold Arctic conditions — their thick fur and fat layer help them survive. They cannot live in warmer climates, so their distribution is limited to cold regions. |
Water availability | Water is essential for life. The amount of available water affects the types of plants and animals that can survive in an ecosystem. | Cacti and other succulents are adapted to dry desert conditions by storing water and reducing water loss. Amphibians, however, need moist environments to reproduce and cannot live in deserts. |
Soil quality (mineral content and pH) | Soil provides water, minerals, and a place for plants to anchor. Poor or acidic soils can limit plant growth, which affects the whole food web. | Heather grows well on acidic moorland soils, but grasses and many crops do not. This influences which animal species can live in that habitat. |
Oxygen availability (in aquatic habitats) | Some aquatic animals (such as fish) can only survive in water with high oxygen concentrations. | In warm, stagnant ponds, oxygen levels can drop, causing fish and other animals to die or migrate to better-oxygenated areas. |
Pollution | High levels of pollution can damage habitats and kill sensitive species, reducing biodiversity. | Lichens are sensitive to air pollution (e.g. sulfur dioxide). Few lichens are found in areas with high air pollution, so their presence indicates clean air. |
Worked Example
Scientists investigate the effect of changing the concentration of carbon dioxide on the biomass of wheat plants.
This is the scientists’ method.
set up five glasshouses, each containing 100 wheat plants
maintain different carbon dioxide concentrations in each glasshouse: 0.03%, 0.06%, 0.10%, 0.15% and 0.20%
keep all other conditions, such as light intensity, temperature and water supply, the same
leave the plants to grow for two months
measure the dry biomass of the wheat plants in each glasshouse
calculate the mean biomass for each carbon dioxide concentration
The scientists’ results are shown in the graph below.
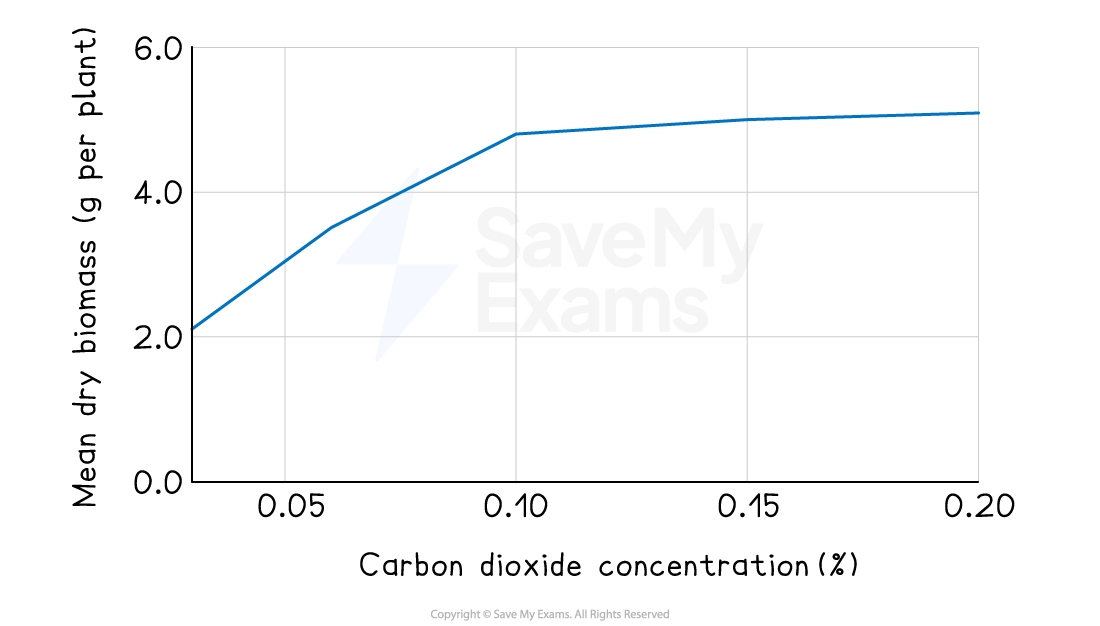
The scientists conclude that increasing the concentration of carbon dioxide increases the growth of wheat plants.
Discuss the scientists’ conclusion, referring to the information in the graph and the scientists’ method in your answer.
(5 marks)
An answer that makes reference to five of the following points:
Yes – conclusion supported because:
mean biomass increases as carbon dioxide concentration increases (1)
greatest increase occurs between 0.03% and 0.10% (1)
carbon dioxide is a reactant in photosynthesis (1)
higher carbon dioxide concentration increases the rate of photosynthesis, producing more glucose for growth (1)
But not fully conclusive because:
graph shows that biomass levels off at higher carbon dioxide concentrations (1)
suggests another factor (e.g. light, temperature or nutrients) becomes limiting (1)
conclusion states “increasing CO₂ increases growth” but this is only true up to an optimum (1)
only one plant species tested / may not apply to other plants (1)
experiment carried out in glasshouses, not in natural field conditions (1)
only five CO₂ concentrations tested / may not show full trend (1)
(maximum 5 marks)
Biotic factors
A biotic factor is a living factor in the environment
e.g. competition, predation and disease
How biotic factors affect the population size and distribution of organisms
Biotic factor | How biotic factor affects community | Example |
|---|---|---|
Availability of food | More food means organisms have a higher chance of surviving and reproducing. This allows populations to increase. When food is scarce, only the best-adapted organisms survive and reproduce. | Rainforest ecosystems have a rich food supply that supports a wide variety of species. Deserts, by contrast, have limited food sources, so fewer species can survive there. |
New predators | In balanced ecosystems, predators catch enough prey to survive but not so many that they wipe out the prey population. If a new predator is introduced, it can disrupt this balance and cause prey populations to decline. | Red foxes were introduced to Australia in the 1800s for recreational hunting and have caused the decline of many native species, such as small mammals and birds. This has also reduced the food supply for native predators. |
New pathogens | If a new pathogen enters an ecosystem, the populations living there may have no immunity or resistance to it, causing their numbers to fall sharply or be wiped out entirely. | Ash dieback disease, caused by the fungus Hymenoscyphus fraxineus, has infected millions of ash trees in Europe since it was introduced from Asia. Many native ash populations have been severely reduced. |
Competition | If two species compete for the same resource(s) and one is better adapted, that species will outcompete the other. The less well-adapted species may decline or even become extinct if its population falls too low to breed successfully. | North American grey squirrels were introduced to the UK in the 1800s and have outcompeted native red squirrels for food and nesting sites. Grey squirrels also carry a virus that red squirrels are not resistant to. |
Worked Example
Scientists investigate the effect of introducing grey squirrels into a woodland habitat that is occupied by red squirrels.
The scientists record the population sizes of both red squirrels and grey squirrels in the woodland over a 20-year period.
Grey squirrels are introduced to the woodland in year 6 of the study.
The graph shows the scientists’ results.

Question:
Comment on the changes in population size of the red squirrel and the grey squirrel over the 20 years.
(5 marks)
An answer that makes reference to five of the following points:
Description of trends:
red squirrel population increases at first, then decreases after grey squirrels are introduced (1)
grey squirrel population increases after introduction (1)
as grey squirrel population increases, red squirrel population decreases (1)
red squirrel population becomes much smaller / may disappear by the end of the study (1)
Explanation (reasons why):
grey squirrels outcompete red squirrels for food and habitat (1)
grey squirrels are better adapted to the environment (eg. can use a wider range of food sources) (1)
grey squirrels may transmit disease to red squirrels (1)
red squirrels are outcompeted, so their population decreases (1)
(maximum 5 marks)
Additional guidance
Answers that refer only to one species or do not include explanation cannot gain full marks
Award marks for both description (interpreting trends in the graph) and explanation (biological reasoning)
Maximum 3 marks for description and 2 marks for explanation, or vice versa
“better adapted” for mp6 must be linked to a specific advantage (eg. food use, disease resistance) to gain credit — not credited alone
Example exam answer (5/5)
After grey squirrels are introduced in year 6, their population increases steadily while the red squirrel population decreases. This shows that grey squirrels outcompete red squirrels for food and habitat. Grey squirrels are better adapted because they can eat a wider range of food, eg, unripe acorns. They may also spread disease to red squirrels, causing their numbers to fall further. By the end of the study, the red squirrel population is very low.
Examiner Tips and Tricks
You should be able to extract and interpret information from charts, graphs and tables relating to the effect of biotic and abiotic factors on organisms within a community
When answering questions that refer to a chart, graph or table, remember to reference specific figures from the data to support your answer, as seen in the example above.

Unlock more, it's free!
Join the 100,000+ Students that ❤️ Save My Exams
the (exam) results speak for themselves:

Was this revision note helpful?
Build on this topic