Show Questions (AQA A Level Business): Revision Note
Syllabus Edition
First teaching 2023
Last exams
Exam code: 7132

How to answer 'show' or 'complete' questions
These questions occasionally appear in Section B of Paper 1
They are worth 2–4 marks each
They require you to complete a diagram, chart or graph by adding lines, labels or values, rather than writing a prose answer
They test whether you can interpret data and apply it accurately in a visual format
Different types of diagram can appear in this question format
Common examples
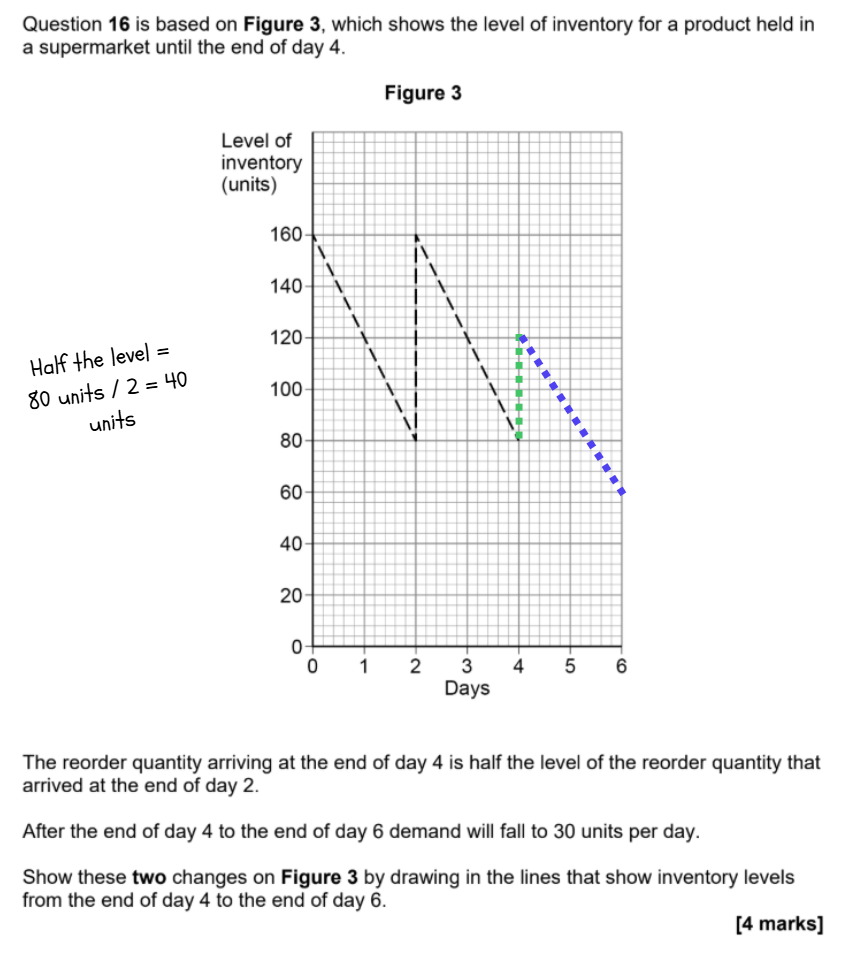
Inventory control charts
A partially completed inventory chart is provided
You are given additional information — for example, a new reorder quantity, a change in daily demand, or a new lead time
You must draw the continuation of the inventory line accurately onto the chart, reflecting the new information given
Marks are awarded for correctly plotting:
The rate at which inventory is used (the slope of the line)
The reorder level and reorder quantity (the height at which the line restarts)
The timing of deliveries (where the line jumps back up)
Break-even charts
A partially completed or blank break-even chart may be provided
You may be asked to add a line (e.g. a new total revenue or total cost line following a price or cost change), label a point or identify a value from the chart
Marks are awarded for accuracy of position and correct labelling
How marks are awarded
Marks are awarded for each correctly plotted element — typically one mark per feature
A line drawn at the wrong slope, wrong height or wrong position will not score that mark, even if the rest of the diagram is correct
Neatness matters: lines should be ruled where straight lines are required, and should be clearly distinguishable from existing lines on the chart
How to approach these questions
Step 1 — Read the additional information carefully
All the data needed to complete the diagram is given in the question
Identify exactly what has changed — for example, a new reorder quantity, a different rate of daily usage, or a changed delivery time.
Step 2 — Work out the values before drawing
Calculate the key figures (e.g. how many units per day will be used, what level inventory will reach before reorder) before putting pen to paper
Writing rough working in the margin reduces the risk of drawing a line at the wrong angle or height.
Step 3 — Draw clearly and accurately
Use a ruler for straight lines
Start each line from the correct point on the chart — not from where it seems roughly right
If the question asks for multiple changes, complete them one at a time
Step 4 — Check against the information given
Once drawn, re-read the question and check that every piece of information provided has been reflected in the diagram.
Common mistakes
Drawing a line that continues at the same rate as before, rather than reflecting the changed daily usage figure
Misreading the scale on the vertical axis, leading to lines drawn at the wrong height
Plotting the reorder quantity from the wrong starting point on the chart
Drawing freehand curved lines where a straight ruled line is needed
Forgetting to apply all the changes — the question often gives two separate pieces of new information, both of which must be reflected
Top tips for success in 'show' and 'complete' questions
Read the question twice before touching the diagram
These questions often give two separate pieces of new information, and missing one will cost marks
Work out the numbers on paper first
E.g. For an inventory chart, calculate exactly how many units will be used per day and where the line should restart after delivery — then draw
Always use a ruler
A wobbly freehand line through the correct point will still score the mark, but an inaccurate line will not — precision matters more than appearance
Check the scale of the axes before drawing
A line that looks right visually may be plotted at the wrong value if you have misread the scale
These questions are worth 2–4 marks and should take no more than four or five minutes
Do not overthink them — all the information needed is in the question

Unlock more, it's free!
Join the 100,000+ Students that ❤️ Save My Exams
the (exam) results speak for themselves:

Was this revision note helpful?
