Practical: Investigating Diffusion & Osmosis (Edexcel IGCSE Biology): Revision Note
Exam code: 4BI1

Written by: Lára Marie McIvor
Updated on
Practical: Factors that Influence Diffusion
Diffusion is the movement of particles from a region of higher concentration to a region of lower concentration
The rate of diffusion is influenced by several factors:
Surface area
Temperature
Concentration gradient
Diffusion distance
Alkaline agar blocks can be used to investigate diffusion
Agar is a clear jelly-like substance
When molten agar is mixed with sodium hydroxide (an alkali) and phenolphthalein indicator, pink agar is produced. When cooled, the solid pink agar can be cut into blocks
Phenolphthalein is an indicator that is colourless in solutions with a pH <8.3 and pink in alkaline solutions
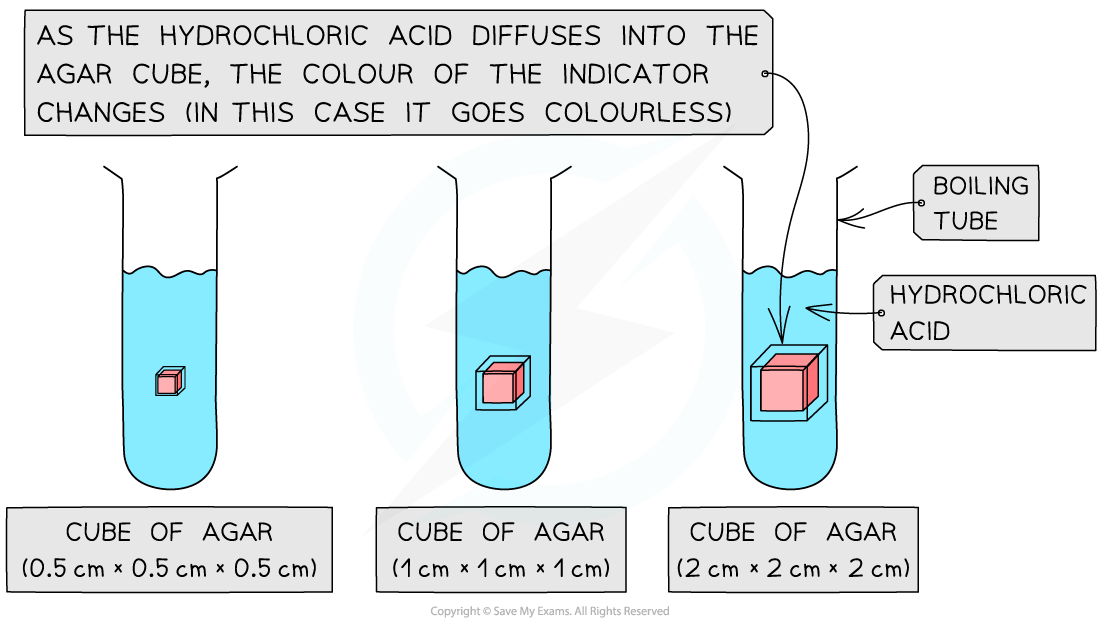
The pink alkaline agar blocks will turn colourless when placed in an acidic solution (eg. dilute hydrochloric acid)
As the acid diffuses into the agar blocks, a neutralisation reaction occurs between the acid and the alkaline sodium hydroxide in the agar block
The effect of surface area to volume ratio (SA:V) on diffusion can be investigated using these agar blocks
Investigating the effect of surface area to volume ratio on diffusion
Apparatus
Pink agar (contains sodium hydroxide and phenolphthalein indicator)
White tile
Scalpel (knife)
Dilute hydrochloric acid
Beakers
Thermometer
Water baths
Ice
Forceps
Stopwatch
Safety
Dilute hydrochloric acid
Scalpel
Agar prepared with sodium hydroxide and phenolphthalein indicator
Method
Prepare the agar cubes:
Using a scalpel (knife), cut the cubes of pink agar on the white tile to different dimensions
Suggested sizes are cubes with 0.5 cm, 1 cm, and 2 cm side lengths
To calculate the surface area to volume ratio for each cube:
Surface area = (area of 1 side) x number of sides
Volume = length x width x height
Cube side length (cm) | Surface area (cm2) | Volume (cm3) | SA : V |
0.5 | 1.5 | 0.125 | 12 : 1 |
1 | 6 | 1 | 6 : 1 |
2 | 24 | 8 | 3 : 1 |
Pour 50 ml of dilute hydrochloric acid into a beaker
Using forceps, place the 0.5 cm cube into the beaker and start a timer
Observe what happens. Stop the timer when the pink agar tube has turned colourless. Record the time for this to happen
Repeat the same steps at least two more times for cubes with the same side length (0.5 cm) - this is to increase reliability in results
Repeat the experiment for cubes with different side lengths (eg. 1 cm and 2 cm side lengths)
Results and analysis
When the agar cubes are placed in the hydrochloric acid, the acid diffuses into the cube and reacts with the sodium hydroxide. This causes the pink phenolphthalein indicator to turn colourless
The time taken for cubes of different sizes to become colourless can be compared
Smaller cubes have a larger surface area to volume ratio (SA:V) than larger cubes. This means that for their size, smaller cubes have more surface area available for diffusion per unit volume. As a result:
The acid has more area to enter relative to the cube’s size
The diffusion distance to the centre is shorter
As cube size increases, volume increases faster than surface area, so the SA:V ratio decreases. This means that:
Larger cubes have less surface area per unit volume
It takes longer for the acid to diffuse to the centre of the cube (the diffusion distance to the centre is longer)
In this experiment, the larger cubes take longer to lose their colour
The rate of diffusion through the agar itself remains constant (since the concentration gradient and temperature are the same), but the total rate of exchange depends on the cube’s SA:V ratio
This investigation models how small organisms or cells with a high SA:V ratio can rely on diffusion alone for the exchange of substances like oxygen and carbon dioxide, while larger organisms cannot
Limitations
Determining the endpoint (when the cube turns completely colourless) is difficult to judge accurately and introduces human error
An improvement would be to measure the distance in mm that the acid has diffused into the cubes after a set period of time
This would provide a quantitative measurement that is easier to compare between cubes of different sizes
Another limitation is that it is difficult to cut the cubes to the same size, and small differences in side length affect the surface area to volume ratio and the rate of diffusion.
Use a ruler and a sharp scalpel to cut the cubes as accurately as possible
Did this video help you?
Practical: Factors that Influence Osmosis
Osmosis is the diffusion of water molecules from a dilute solution (high concentration of water) to a more concentrated solution (low concentration of water) across a partially permeable membrane

Osmosis in cells
We can investigate osmosis using cylinders of potato and placing them into distilled water and sucrose solutions of increasing concentration
Apparatus
Potatoes
Cork borer
Knife
Sucrose solutions (from 0 Mol/dm3 to 1 mol/dm3)
Test tubes
Balance
Paper towels
Ruler
Test tube rack
Method
Prepare a range of sucrose (sugar) solutions ranging from 0 Mol/dm3 (distilled water) to 1 mol/dm3
Set up 6 labelled test tubes with 10cm3 of each of the sucrose solutions
Using the knife, cork borer and ruler, cut 6 equally-sized cylinders of potato
Blot each one with a paper towel and weigh on the balance
Put 1 piece into each concentration of sucrose solution
After 4 hours, remove them, blot with paper towels and reweigh them


Experimental method for investigating osmosis in potato cylinders
Results and analysis
The percentage change in mass can be calculated for each piece of potato

Calculating percentage change in mass
The potato in distilled water will gain the most mass due to a high concentration gradient, causing water to move into the cells by osmosis, increasing turgor pressure and making the potato firm.
The potato in the strongest sucrose solution will lose the most mass as water moves out of the cells by osmosis, making them flaccid and the potato soft (as the cells become plasmolysed)

Plasmolysed red onion cells
If there is a potato cylinder that has not increased or decreased in mass, it means there was no overall net movement of water into or out of the potato cells
This is because the solution that the cylinder was in was the same concentration as the solution found in the cytoplasm of the potato cells, so there was no concentration gradient
Limitations
Slight differences in potato cylinders may mean that results aren't reliable or comparable
Solution: for each sucrose concentration, repeat the investigation with several potato cylinders. Making a series of repeat experiments means that any anomalous results can be identified and ignored when a mean is calculated
Applying CORMS evaluation to practical work
The CORMS prompt can be applied to designing an osmosis investigation

CORMS evaluation
For this investigation:
C - changing the concentration of sucrose solution
O - the potato cylinders will all be taken from the same potato or potatoes of the same age
R - repeat the investigation several times to ensure results are reliable
M1 - measure the change in mass of the potato cylinders
M2 - ...after 4 hours
S - control the volume of sucrose solution used, the dimensions of the potato cylinders and each cylinder must be blotted before it is weighed each time
Examiner Tips and Tricks
Questions involving osmosis experiments are common and you should be able to use your knowledge of these processes to explain the results. Don’t worry if it is an experiment you haven’t done – simply figure out where the higher water potential is –this is the more dilute solution with no or few solutes- and explain which way the water molecules will move in relation to this.

Unlock more, it's free!
Join the 100,000+ Students that ❤️ Save My Exams
the (exam) results speak for themselves:

Was this revision note helpful?