1
1 mark
Study Figure 4, an Ordnance Survey map extract which shows a Motor Works.

What is the straight-line distance between the western (X) and eastern (Y) edges of the Motor Works?
0.7 km
0.9 km
1.1 km
1.3 km
Was this exam question helpful?
Exam code: 4GE1
Study Figure 4, an Ordnance Survey map extract which shows a Motor Works.
What is the straight-line distance between the western (X) and eastern (Y) edges of the Motor Works?
0.7 km
0.9 km
1.1 km
1.3 km
Was this exam question helpful?
Identify what is meant by an economic sector.
the chain of production in manufacturing
an economic shift in employment
a classification system for types of employment
a classification of employment structures
Identify the economic sector that includes agriculture as an activity.
quaternary
tertiary
secondary
primary
Define the term raw material.
Was this exam question helpful?
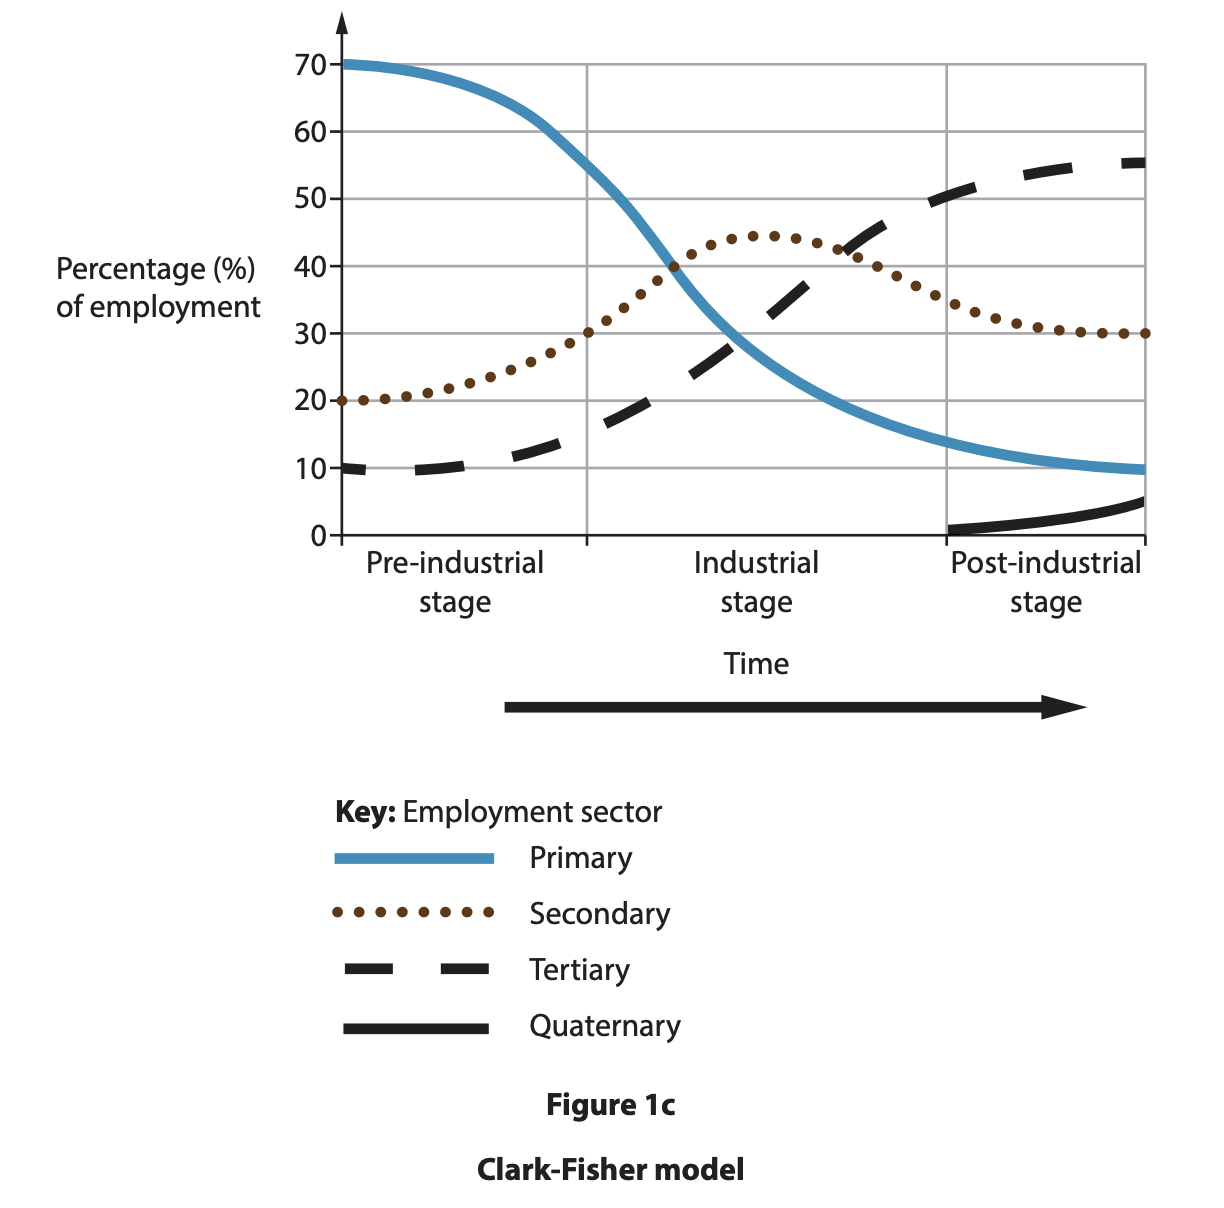
The Clark Fisher model is used to describe the process of industrialisation. Identify the stage which is characterised by agriculture being the most important sector.
pre-industrial phase
industrial phase
development pathway phase
post-industrial phase
Define the term employment structure.
Identify the economic sector that includes manufacturing as an activity.
quaternary
tertiary
secondary
primary
Was this exam question helpful?
What is meant by the term de-industrialisation?
Was this exam question helpful?
State one example of primary employment.
Was this exam question helpful?
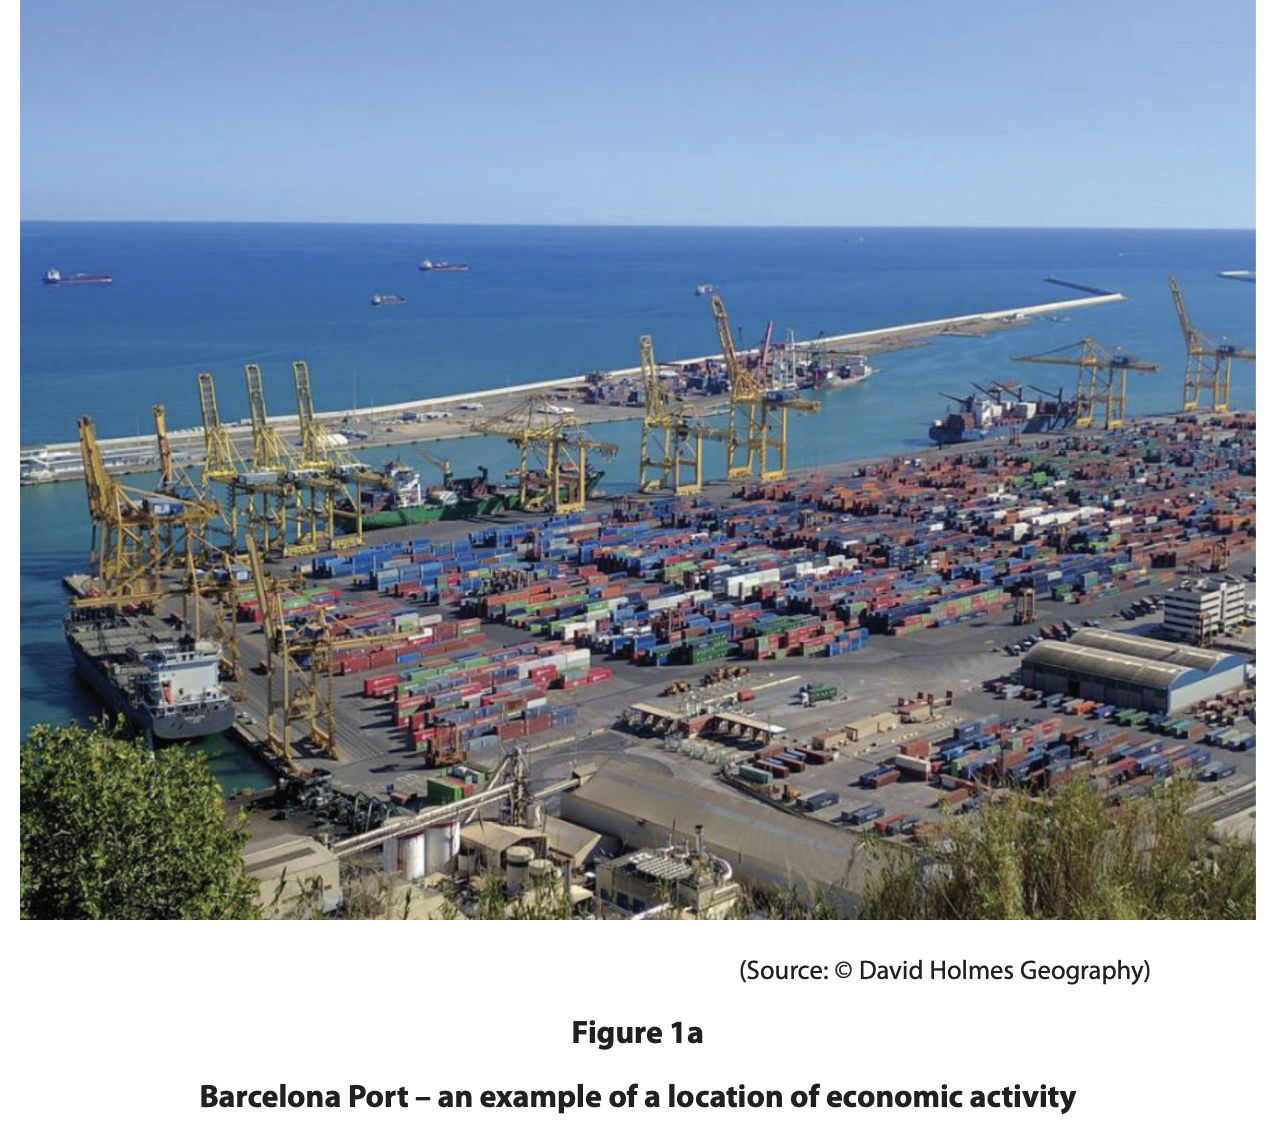
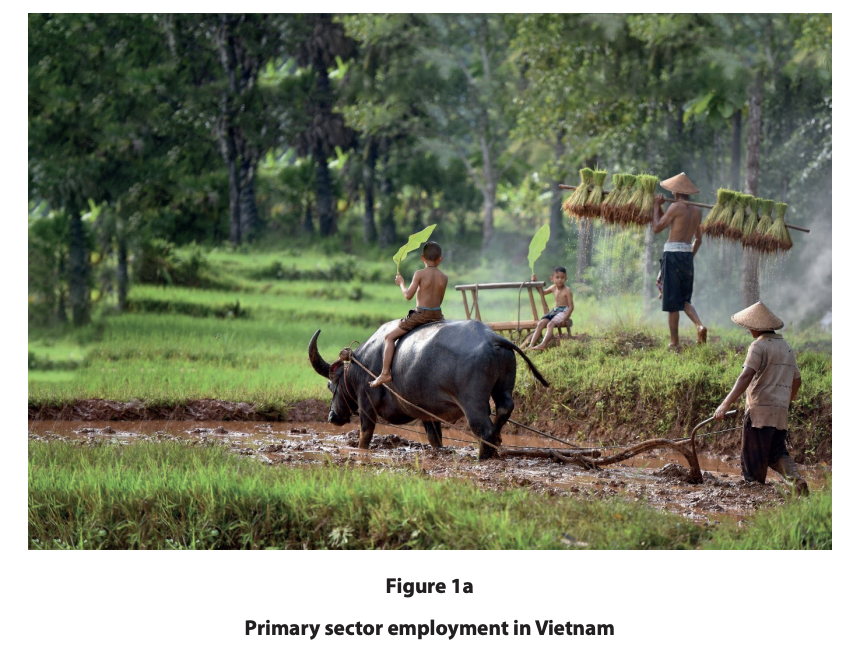
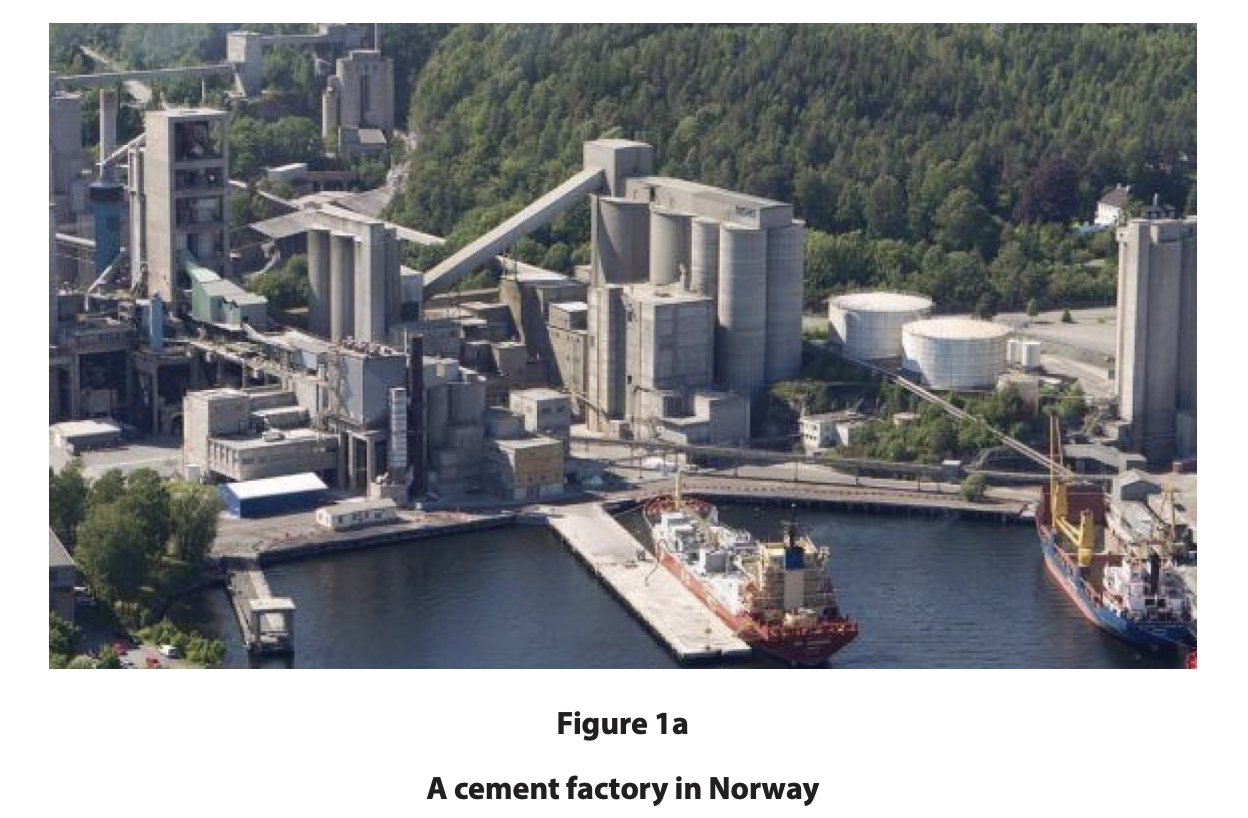
Study Figure 1a.
Suggest one reason for the choice of economic activity in this location.
Was this exam question helpful?
State one example of secondary employment.
Was this exam question helpful?
Identify which employment sector a school teacher belongs to.
Primary
Secondary
Tertiary
Quaternary
Was this exam question helpful?
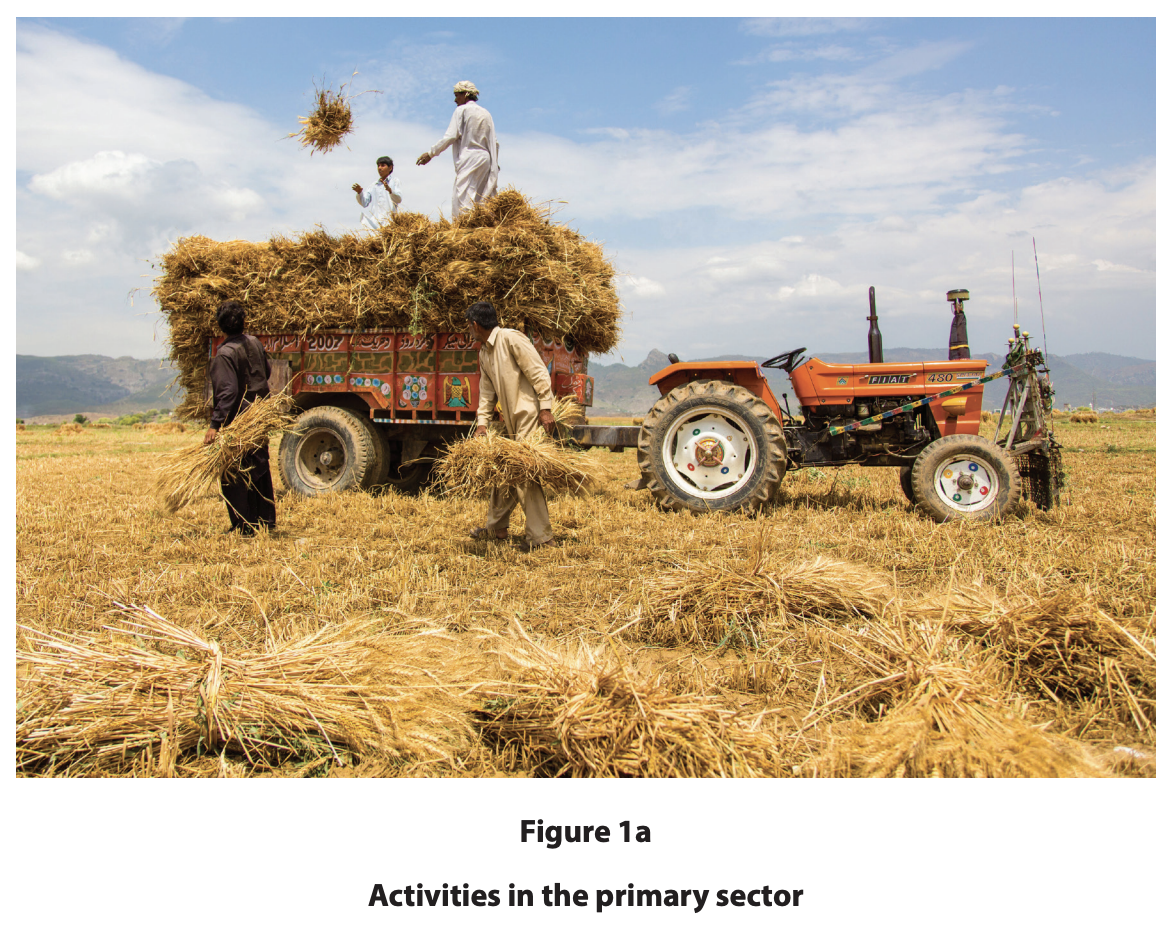
Study Figure 1a.
Suggest one reason why the activities shown are part of the primary sector.
Was this exam question helpful?
State one reason for a decline in employment in the primary sector in many countries.
Was this exam question helpful?
Identify which employment sector a research scientist would belong to.
Primary
Secondary
Tertiary
Quaternary
Was this exam question helpful?
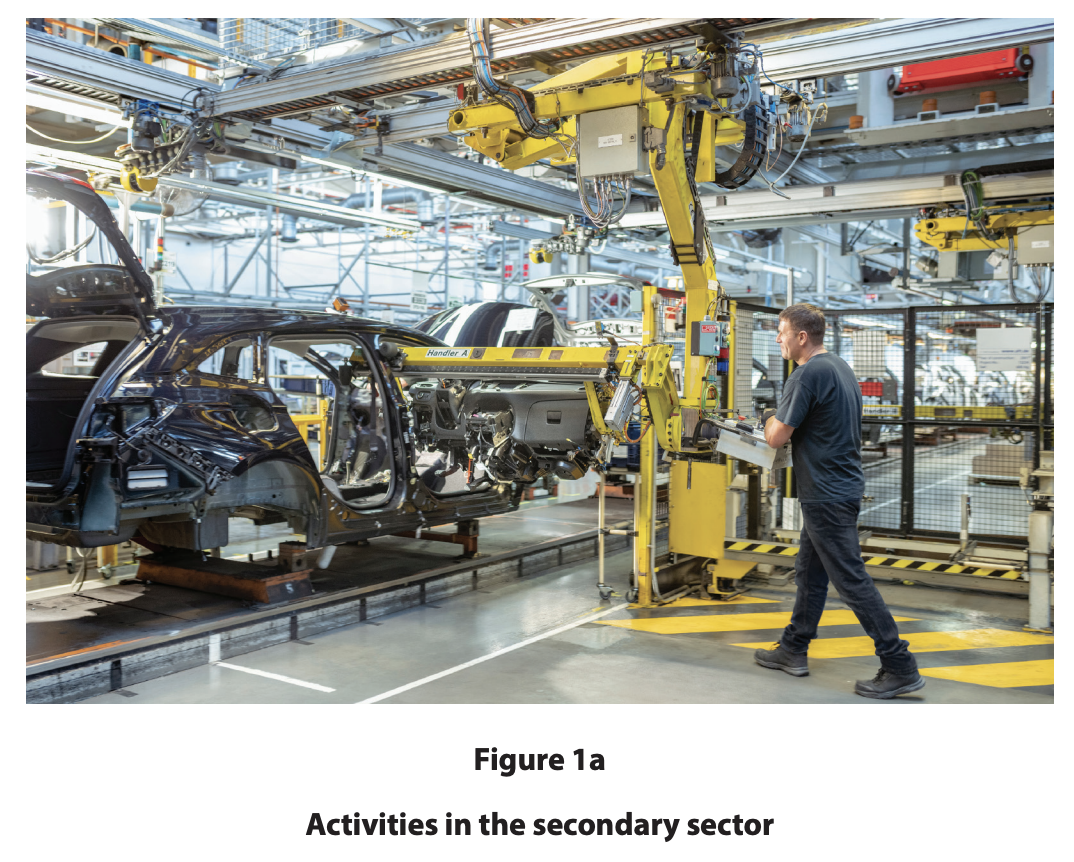
Study Figure 1a.
Suggest one reason this is considered a secondary sector industry
State one reason for the growth in tertiary sector employment in many countries.
Was this exam question helpful?
Study Figure 1a.
Suggest one reason why this might be considered primary sector employment.
Was this exam question helpful?
Name one raw material produced in the primary sector.
Was this exam question helpful?
Identify one type of employment associated with the primary sector.
doctor
computer engineer
miner
teacher
State one factor that affects the location of primary sector economic activity.
Was this exam question helpful?
Study Figure 1a.
Suggest one factor that has influenced the location of this factory.
State one economic activity that is part of the primary sector
Was this exam question helpful?
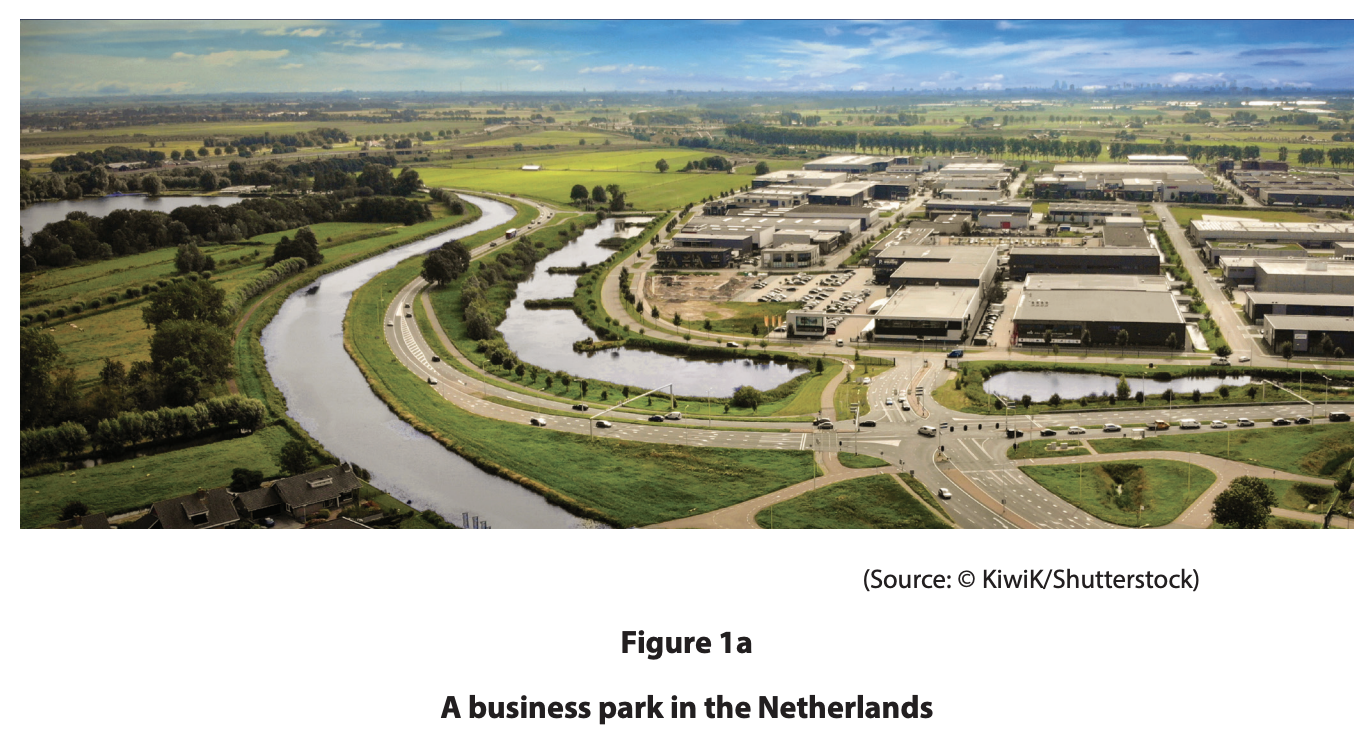
Study Figure 1a.
Suggest one factor that has affected the location of this business park.
Was this exam question helpful?
Study Figure 4 which shows the location of motor works
Suggest three reasons why this location was chosen for the Motor Works.

Was this exam question helpful?
Explain two causes of de-industrialisation.
Was this exam question helpful?
Explain one human and one physical factor that can affect the location of primary sector activities.
Was this exam question helpful?
Explain two factors that affect the location of quaternary sector employment.
Was this exam question helpful?
Explain two factors that affect the location of secondary sector industries
Was this exam question helpful?
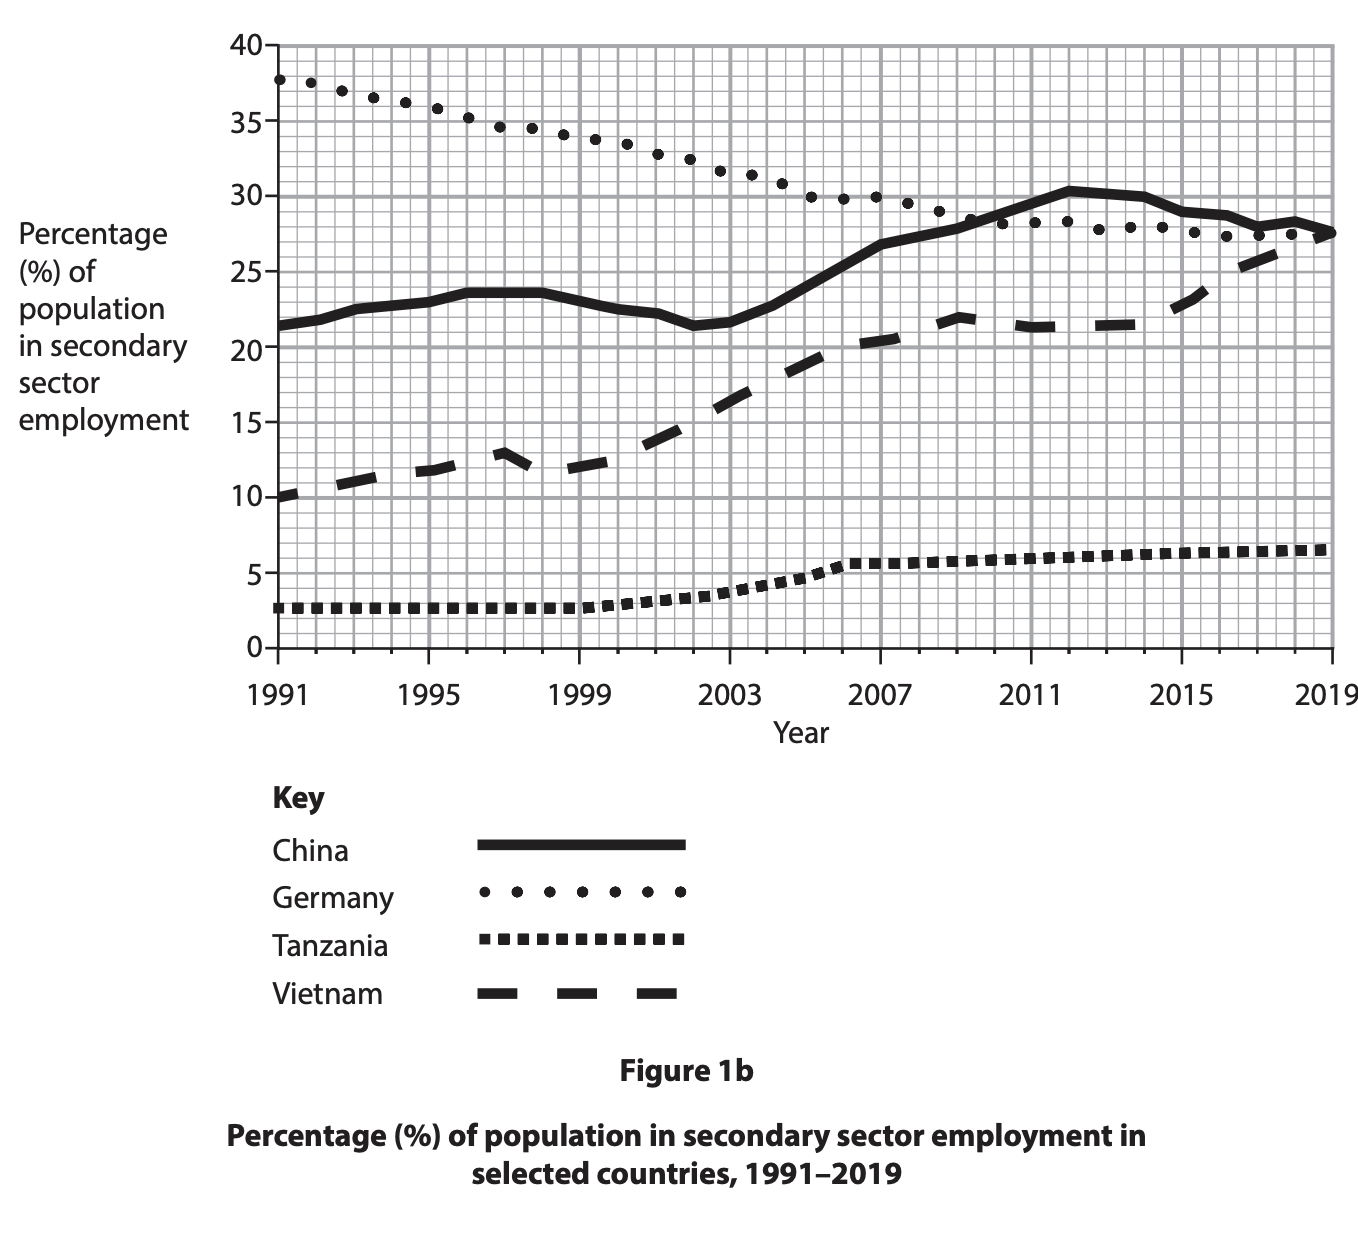
Study Figure 1b.
Suggest one possible reason for changes to secondary sector employment.
Was this exam question helpful?
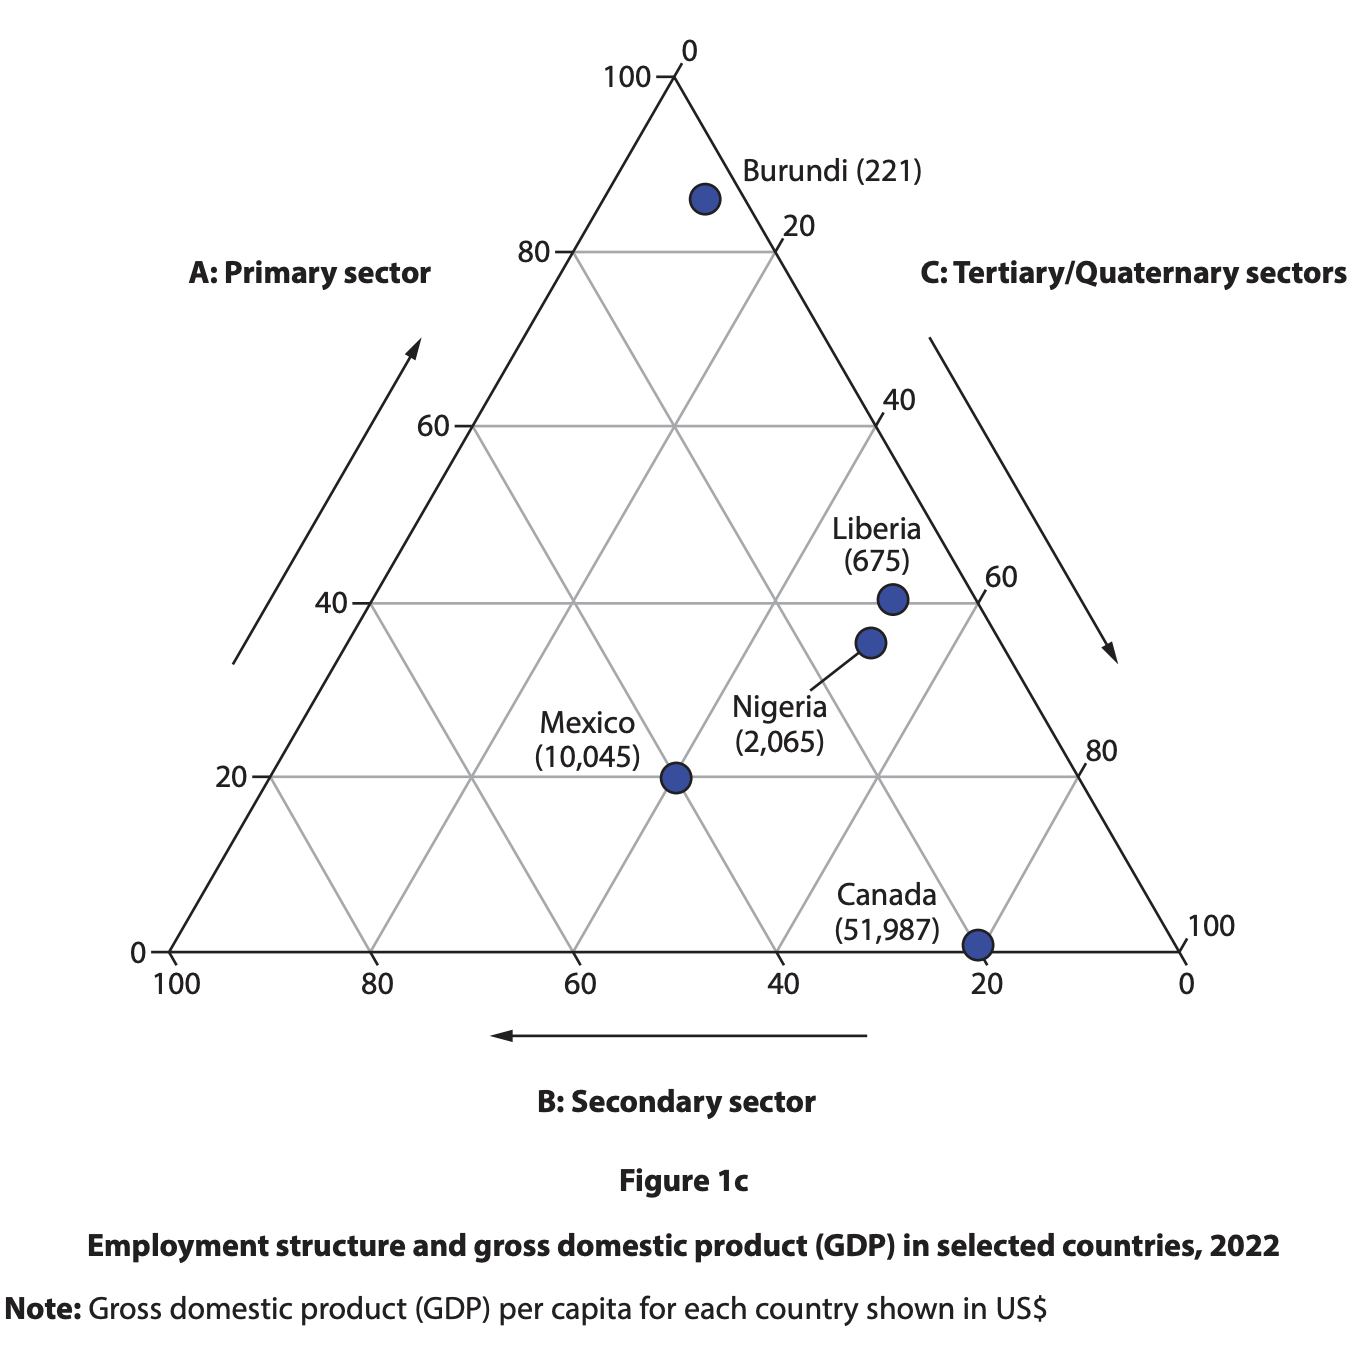
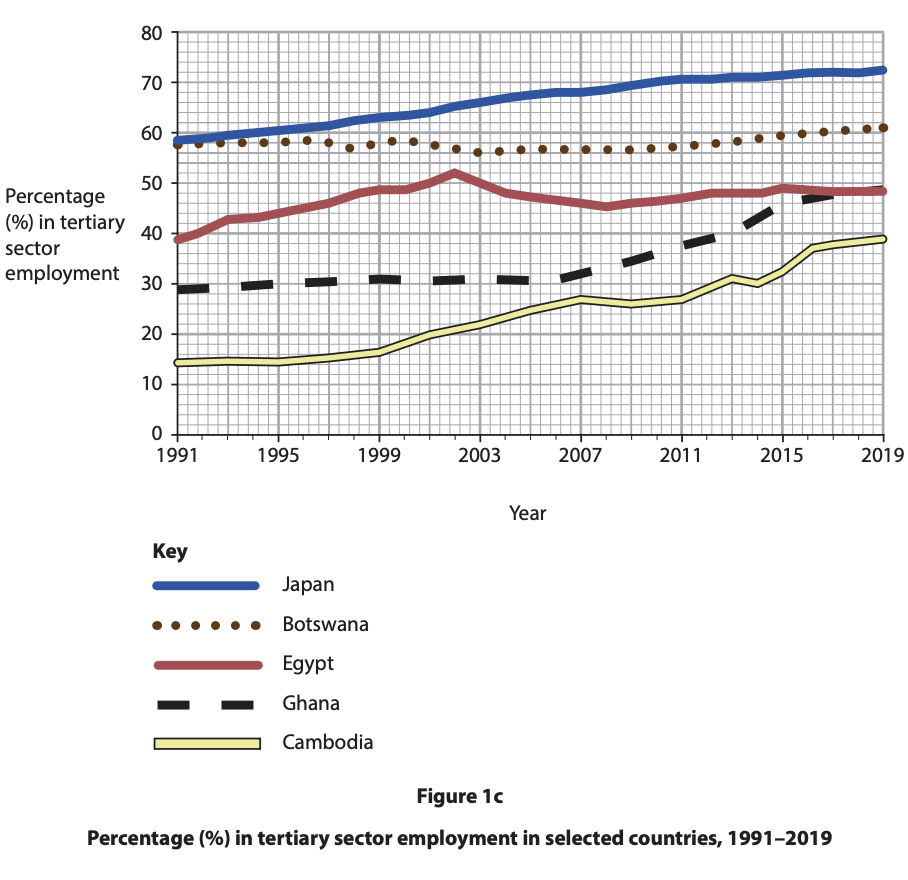
Study Figure 1c below.

Analyse the reasons for changes in primary and quaternary employment.
Was this exam question helpful?
Study Figure 1c.
Analyse possible reasons for the differences in employment structure. You must refer to the resource in your answer.
Was this exam question helpful?
Study Figure 1c.
Analyse the reasons for the changes in the percentage of people employed in the secondary sector.

Was this exam question helpful?
Study Figure 1c.
Analyse the reasons for the differences in the percentage of people employed in the tertiary sector
Was this exam question helpful?
Study Figure 1c.
Analyse reasons for changes in the employment sectors shown. Refer to the resource in your answer.
Was this exam question helpful?