1
2 marks
Study Figure 12a, which shows the continents of origin of refugees entering the USA between 1990 and 2010.

Suggest one issue resulting from refugees entering developed countries like the USA.
Was this exam question helpful?
Exam code: 4GE1
Study Figure 12a, which shows the continents of origin of refugees entering the USA between 1990 and 2010.
Suggest one issue resulting from refugees entering developed countries like the USA.
Was this exam question helpful?
State one reason why a government might want to encourage sustainable tourism.
Was this exam question helpful?
State two ways countries manage migration.
Was this exam question helpful?
Identify the best strategy to make tourism more sustainable.
increasing the number of flights
increasing international investment
limiting information on the tourist sites
limiting numbers of tourists
Was this exam question helpful?
State two geographical characteristics that influence a nation's geopolitical influence.
Was this exam question helpful?
Study Figure 8a.
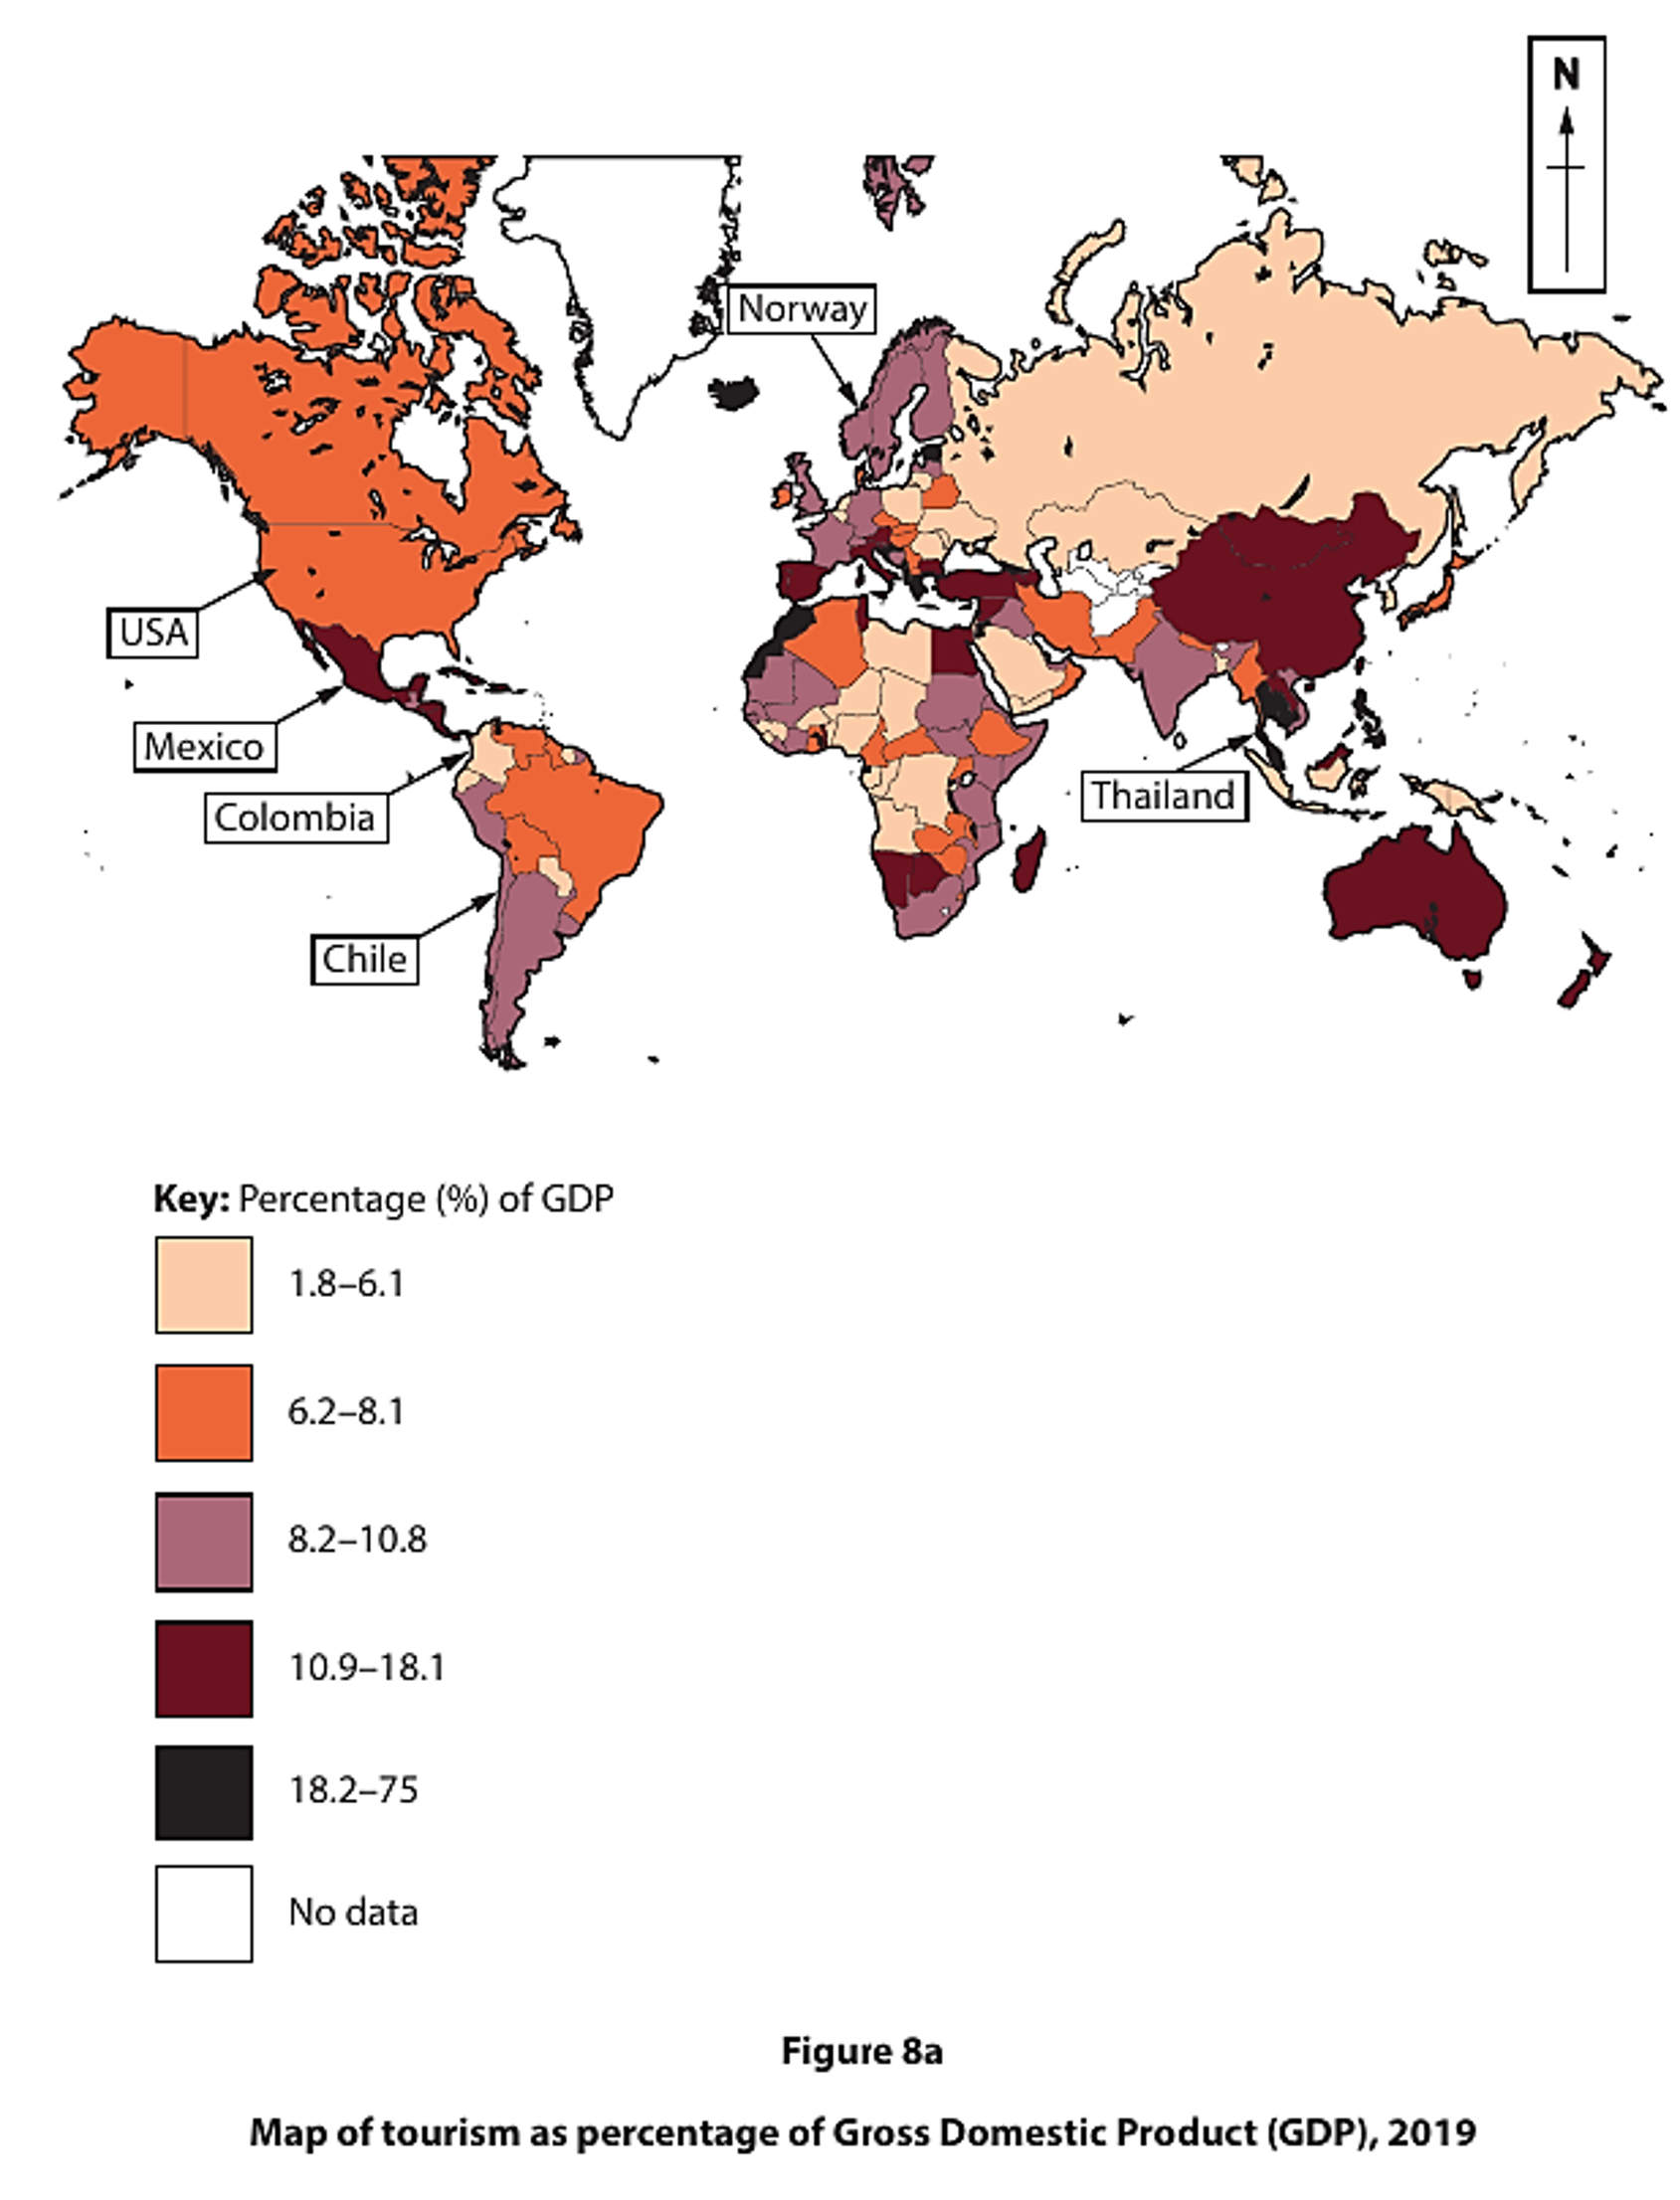
Identify the labelled country with the highest percentage of GDP from tourism.
Compare the patterns shown for Asia and for South America.
Suggest one possible impact of the global pattern shown.
Explain why the data shown in Figure 8a might be a good indicator of a global economy.
Was this exam question helpful?
Describe one way that geopolitical relationships between countries affect international trade.
Was this exam question helpful?
Explain one strategy used by a named developed or developing country to manage long-term migration.
Was this exam question helpful?
Explain two impacts of international migration on the countries migrants have left (donor countries).
Was this exam question helpful?
Explain two positive impacts of migration for destination areas.
Was this exam question helpful?
Explain how geopolitical relationships between countries can affect trade and tourism.
Was this exam question helpful?
Explain how geopolitical relationships between countries can affect migration.
Was this exam question helpful?
Study Figure 8a.
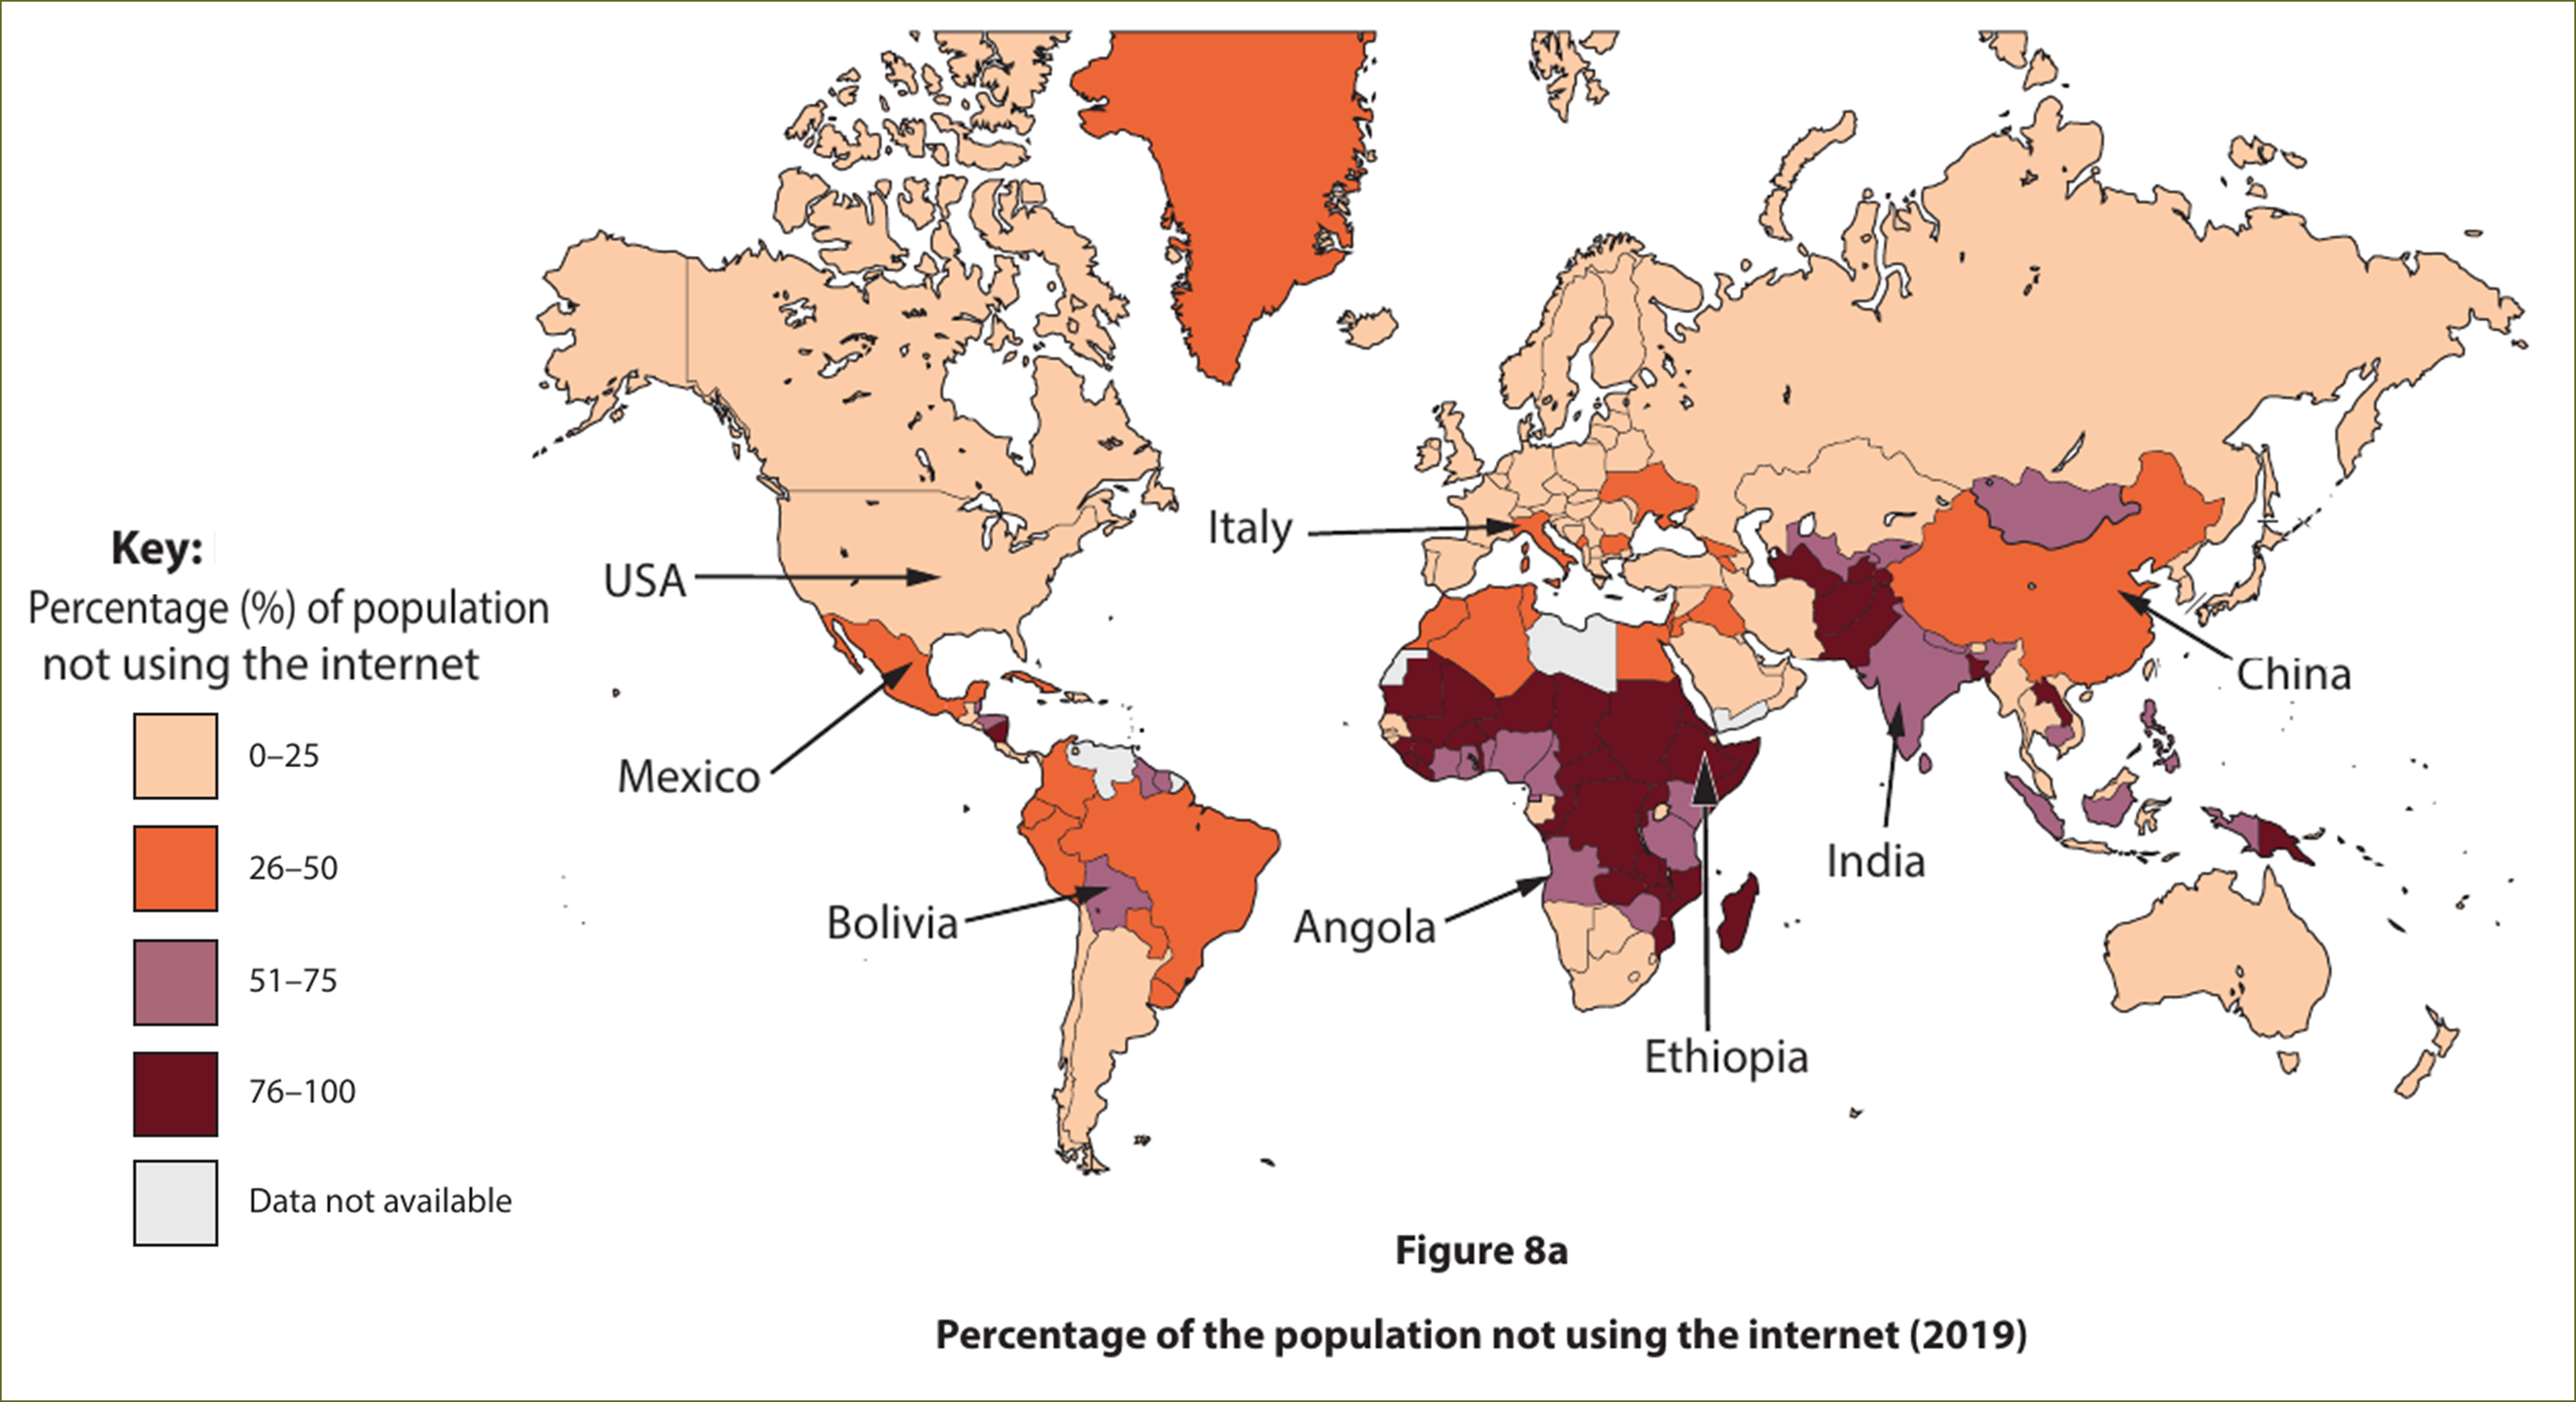
Identify the country with the highest and lowest percentage of the population who do not use the internet.
Suggest two possible reasons for the pattern shown in Figure 8a.
Was this exam question helpful?
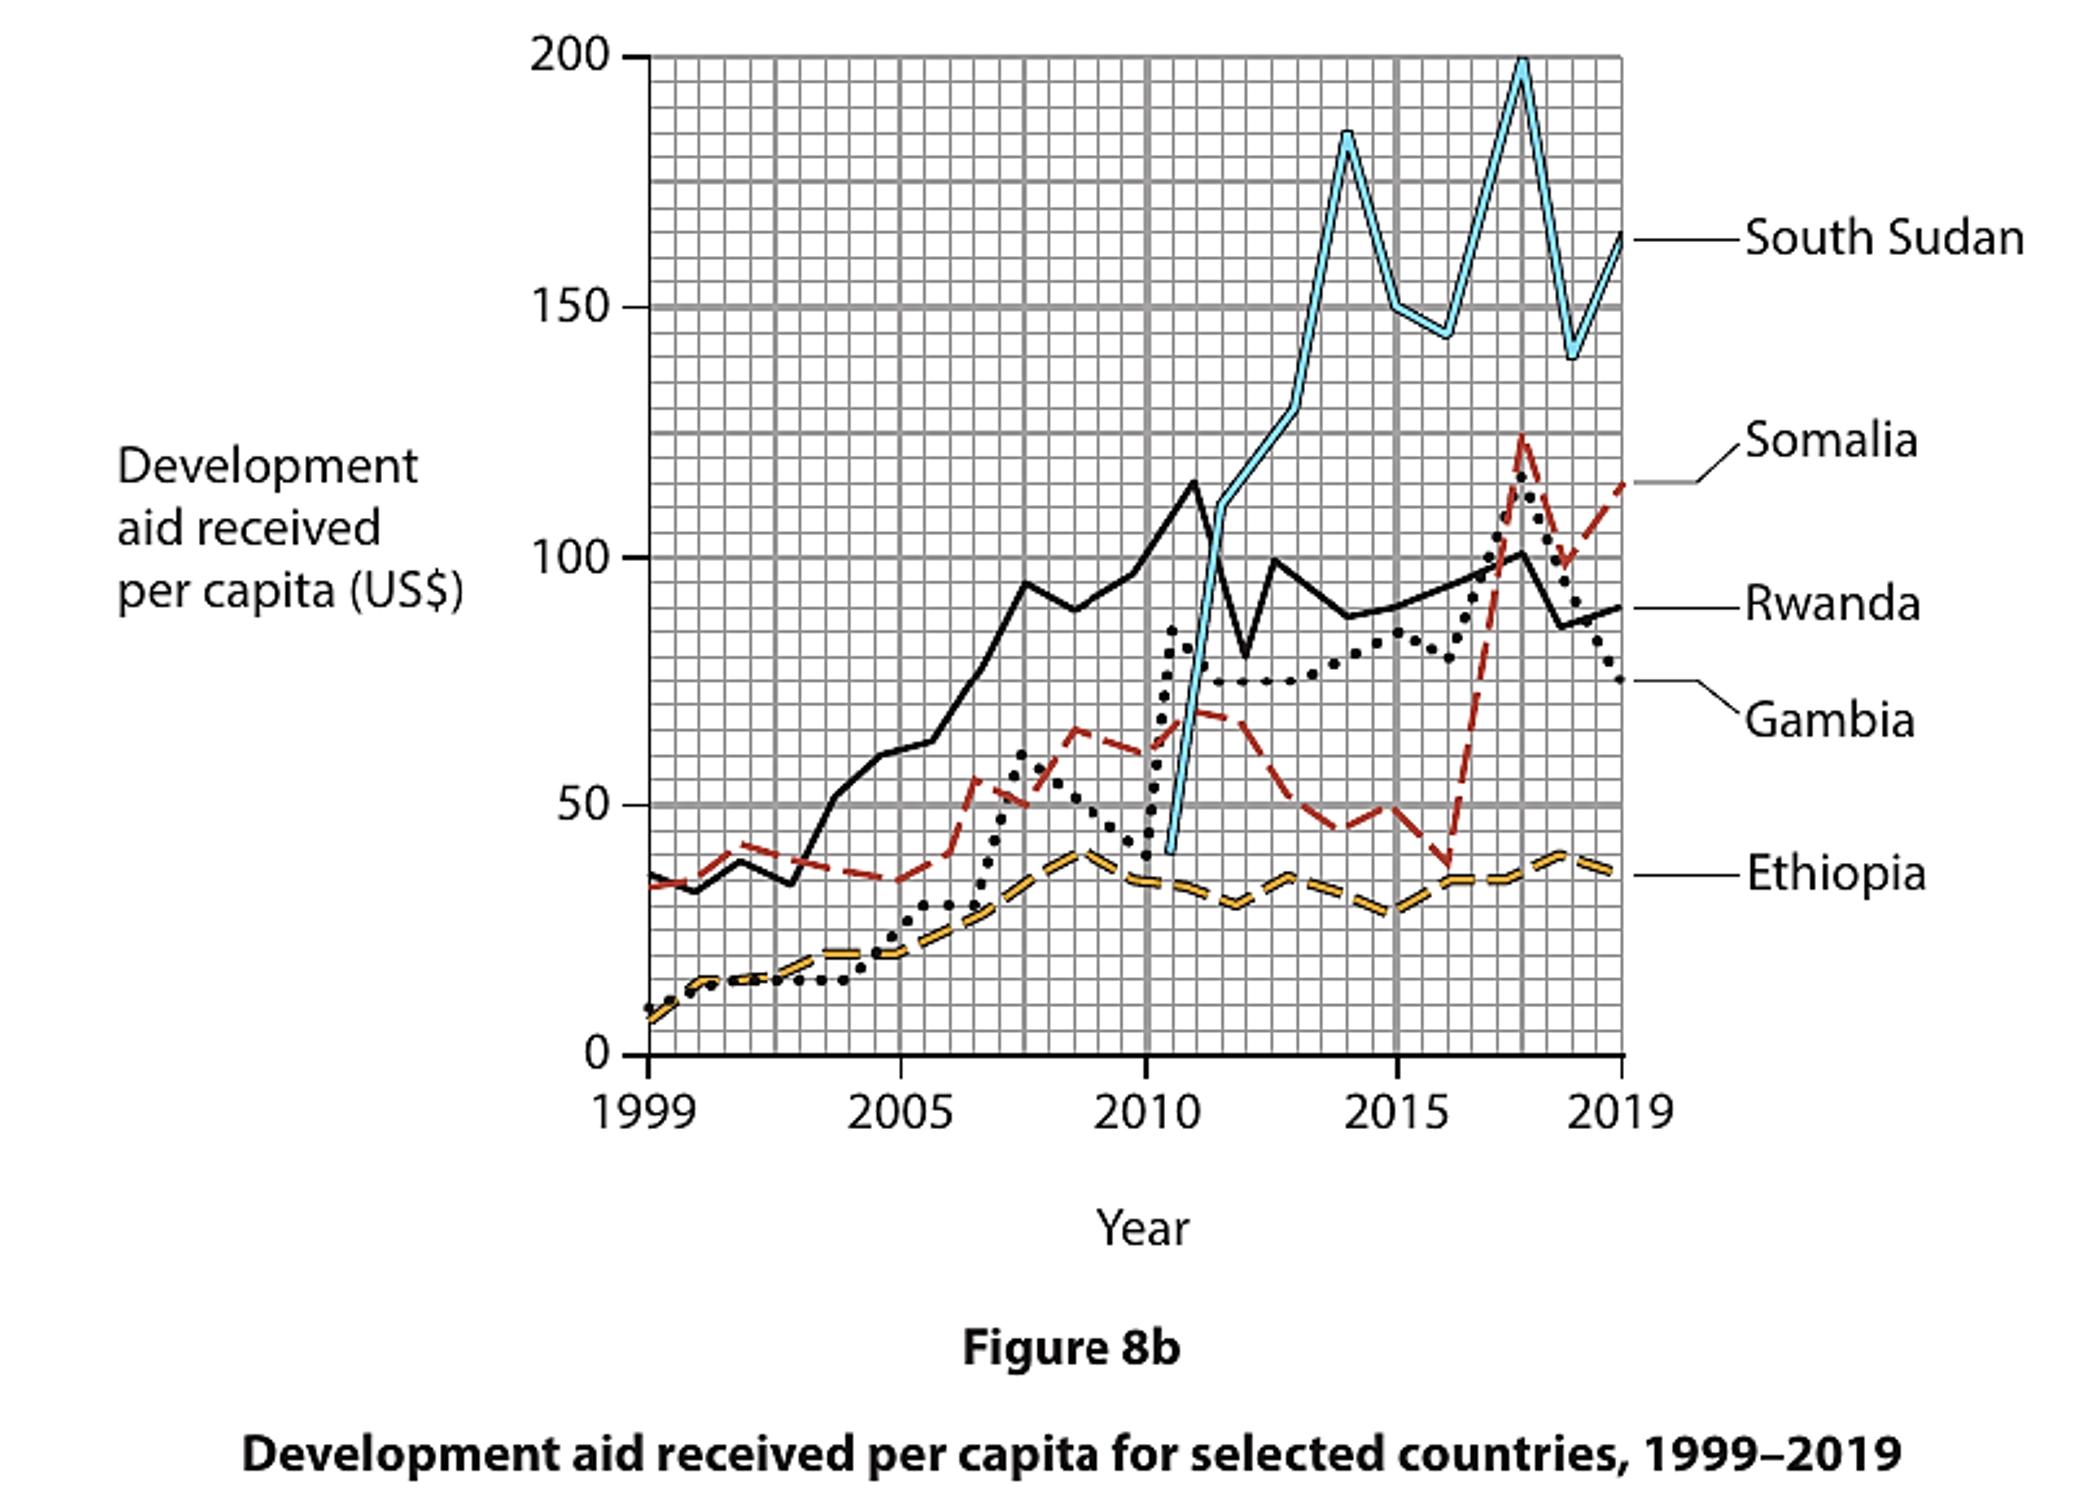
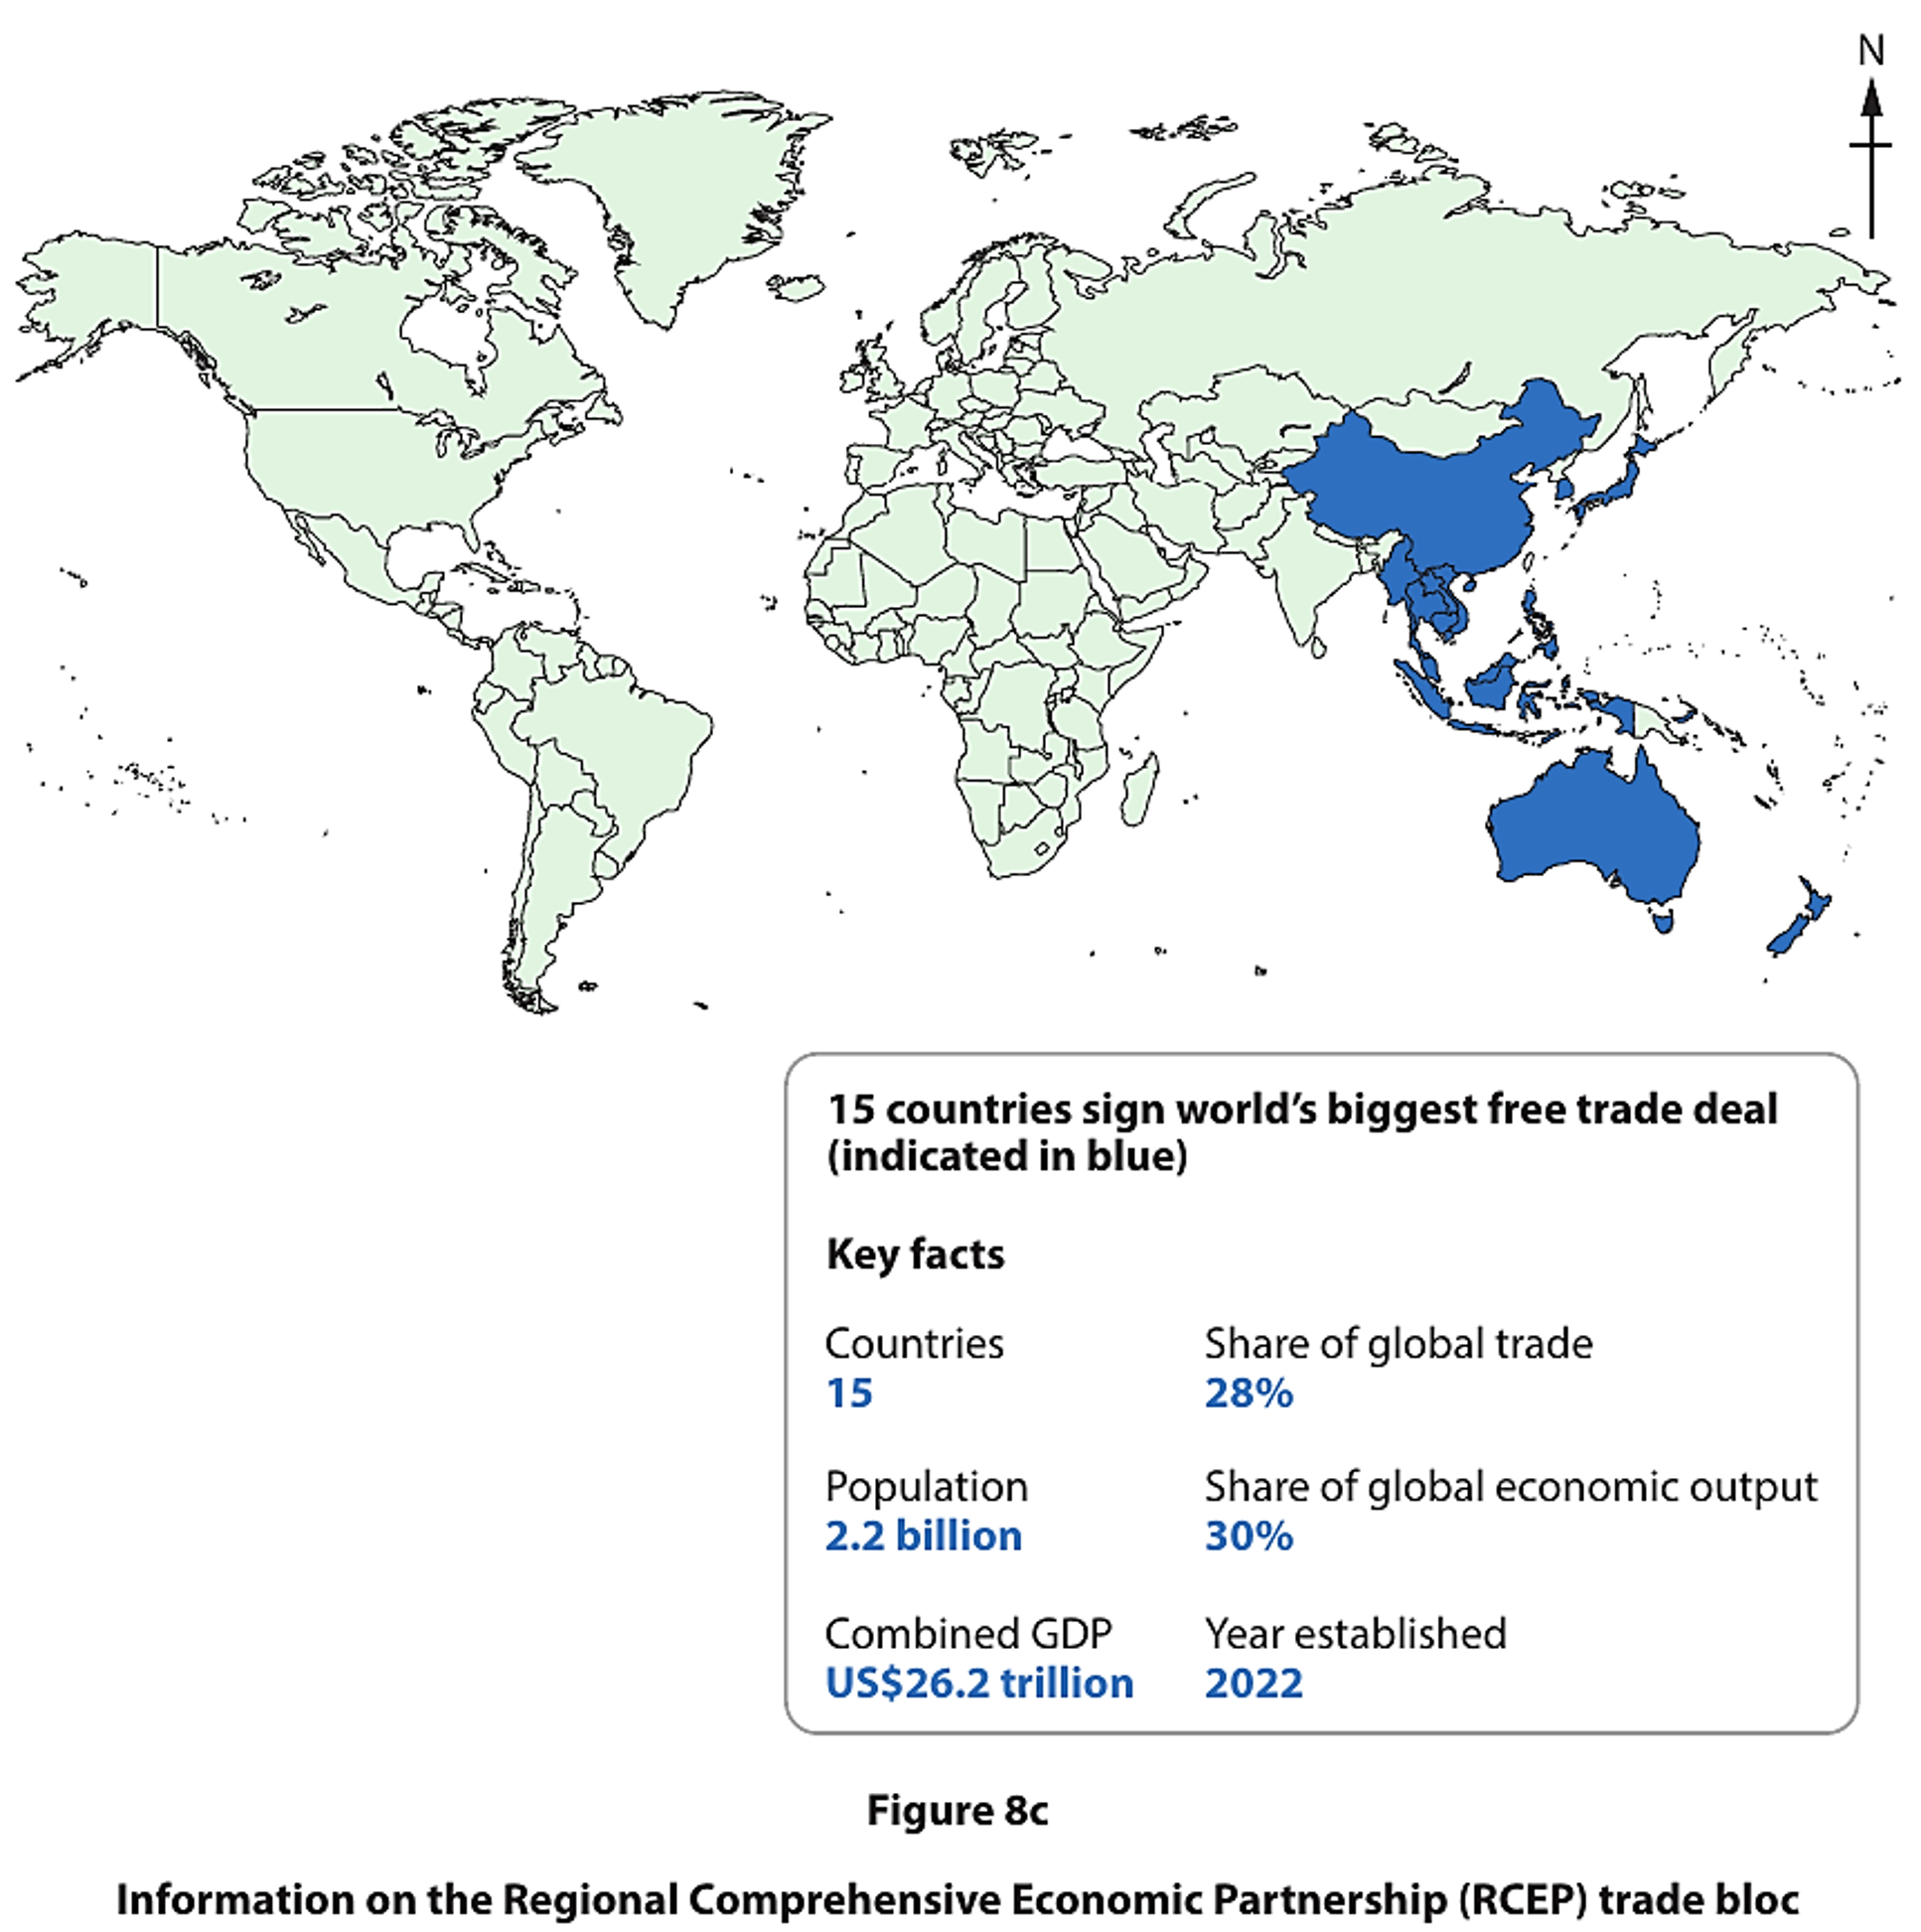
Discuss the view:
'Trade has been the greatest driver of the global economy.'
Use Figures 8b and 8c and your own knowledge and understanding to support your answer.
You must refer to the resources in your answer.
Was this exam question helpful?