1
2 marks
Study Figure 1a below.

Suggest one reason that has influenced the proportions of GDP shown in Turkey.
Was this exam question helpful?
Exam code: 4GE1
Study Figure 1a below.
Suggest one reason that has influenced the proportions of GDP shown in Turkey.
Was this exam question helpful?
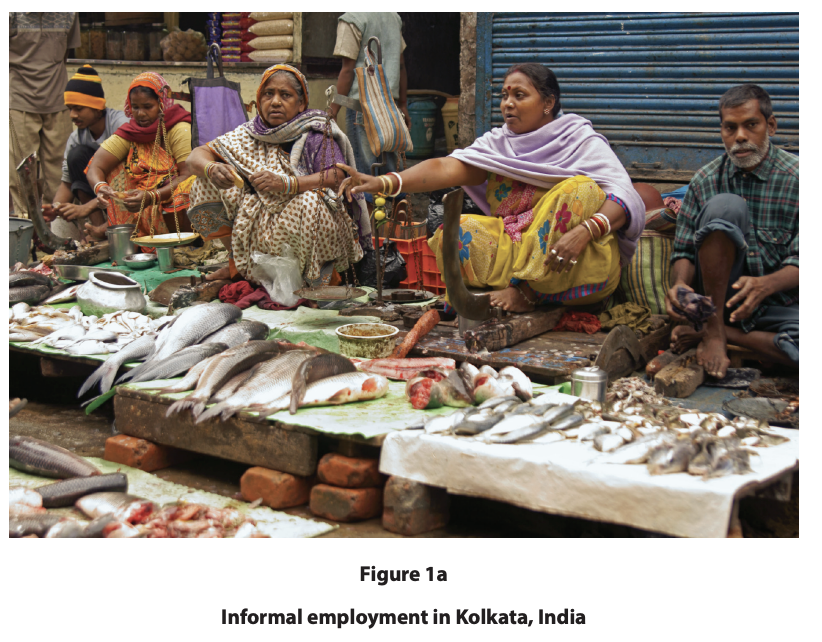
Study Figure 1a below.

Suggest one piece of evidence that shows there is informal employment in this photograph.
Was this exam question helpful?
Identify one cause of employment in the informal sector.
access to pensions
lack of qualifications
population decline
reliable income
Was this exam question helpful?
State one job that can be found in the informal sector.
Was this exam question helpful?
Identify one cause of informal employment.
lack of airport facilities
lack of air pollution
lack of brownfield sites
lack of education
Was this exam question helpful?
State one advantage of informal employment.
Was this exam question helpful?
Study Figure 1a.
Suggest one reason why the activity shown might be considered informal employment.
Was this exam question helpful?
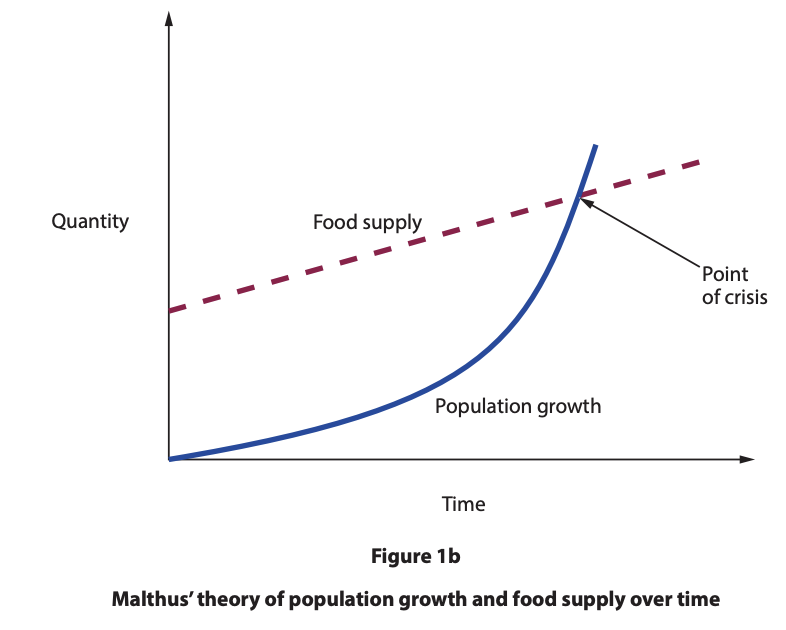
Study Figure 1b below.

Suggest one reason for the shift in manufacturing production shown Figure 1b.
Was this exam question helpful?
For a named developed country, explain one positive and one negative impact of an economic sector shift.
Was this exam question helpful?
For a named developing or emerging country, explain one positive and one negative impact of an economic sector shift.
Named developing or emerging country.....
Was this exam question helpful?
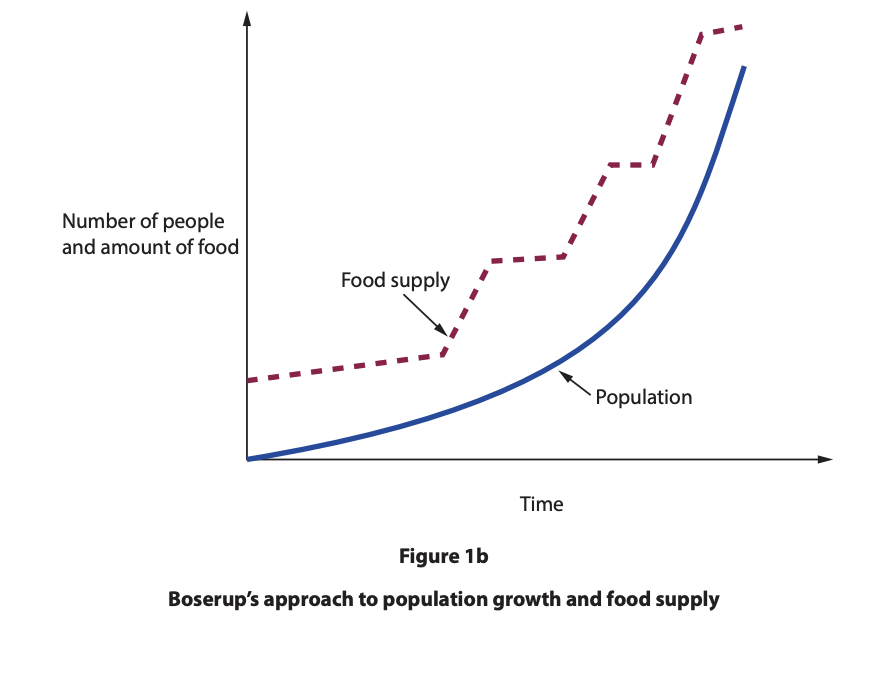
Study Figure 1b
Explain the relationship between population growth and food supply.
Was this exam question helpful?
Study Figure 1b.
Explain the relationship between population growth and food supply.
Was this exam question helpful?
Study Figure 1c.
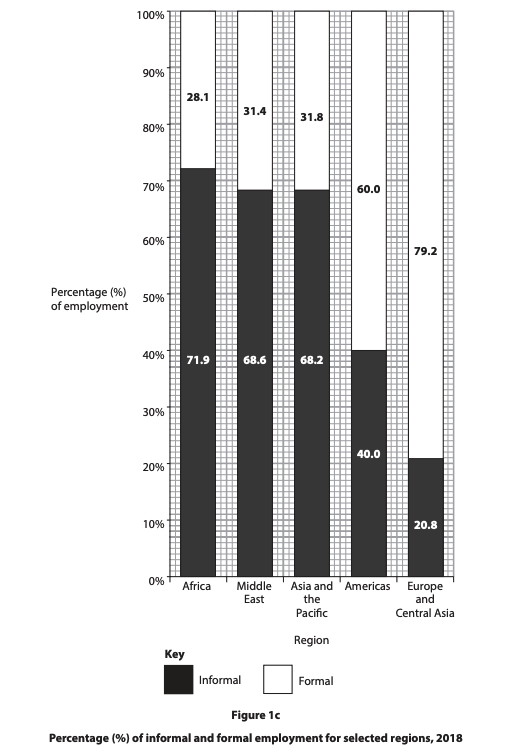
Analyse the reasons for the patterns of informal employment.
Refer to the resource in your answer.
Was this exam question helpful?