Syllabus Edition
First teaching 2018
Last exams 2026
Equilibrium & Disequilibrium (Cambridge (CIE) IGCSE Economics): Revision Note
Exam code: 0455 & 0987

Market Equilibrium
In a market system, prices for goods/services are determined by the interaction of demand and supply
A market is any place that brings buyers and sellers together
Markets can be physical (e.g. McDonald's) or virtual (e.g. eBay)
Buyers and sellers meet to trade at an agreed price
Buyers agree the price by purchasing the good/service
If they do not agree on the price then they do not purchase the good/service and are exercising their consumer sovereignty
Based on this interaction with buyers, sellers will gradually adjust their prices until there is an equilibrium price and quantity that works for both parties
At the equilibrium price, sellers will be satisfied with the rate/quantity of sales
At the equilibrium price, buyers are satisfied that the product provides benefits worth paying for
Equilibrium
Equilibrium in a market occurs when demand = supply
At this point the price is called the market clearing price
This is the price at which sellers are clearing (selling) their stock at an acceptable rate

Any price above or below P creates disequilibrium in this market
Disequilibrium occurs whenever there is excess demand or excess supply in a market
Market Disequilibrium
Disequilibrium: excess demand
Excess demand occurs when the demand is greater than the supply
It can occur when prices are too low or when demand is so high that supply cannot keep up with it
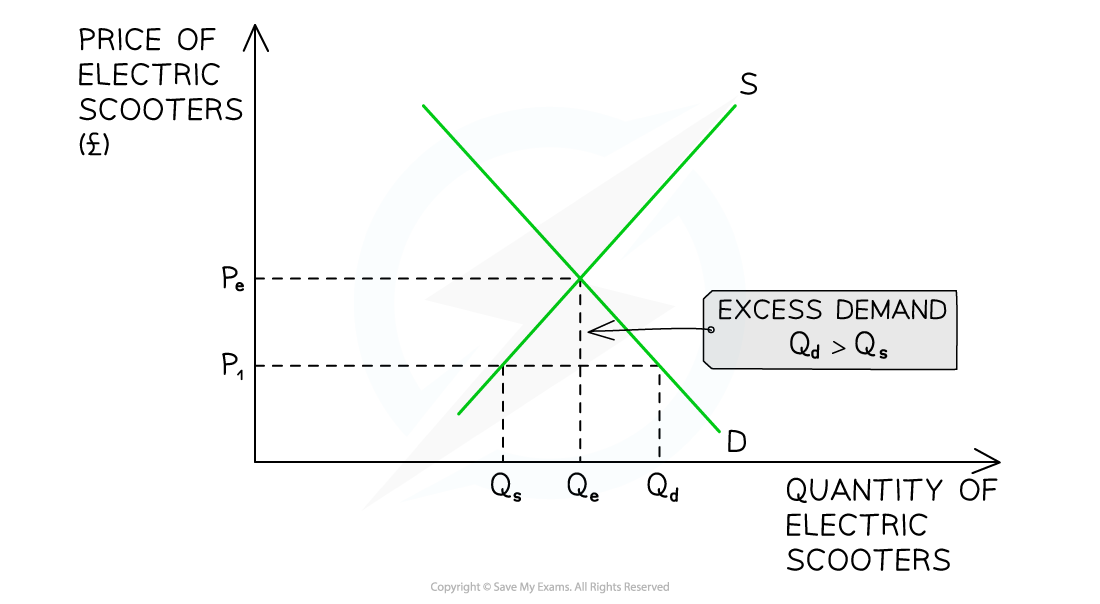
Diagram analysis
At a price of P1, the quantity demanded of electric scooters (Qd) is greater than the quantity supplied (Qs)
There is a shortage in the market equivalent to QsQd
Market response
This market is in disequilibrium
Sellers are frustrated that products are selling so quickly at a price that is obviously too low
Some buyers are frustrated as they will not be able to purchase the product
Sellers realise they can increase prices and generate more revenue and profits
Sellers gradually raise prices
This causes a contraction in QD as some buyers no longer desire the good/service at a higher price
This causes an extension in QS as other sellers are more incentivised to supply at higher prices
In time, the market will have cleared the excess demand and arrive at a position of equilibrium (PeQe)
Different markets take different lengths of time to resolve disequilibrium. For example, retail clothing can do so in a few days. Whereas the housing market may take several months, or even years
Disequilibrium: excess supply
Excess supply occurs when the supply is greater than the demand
It can occur when prices are too high or when demand falls unexpectedly
During the later stages of the pandemic the market for face masks was in disequilibrium
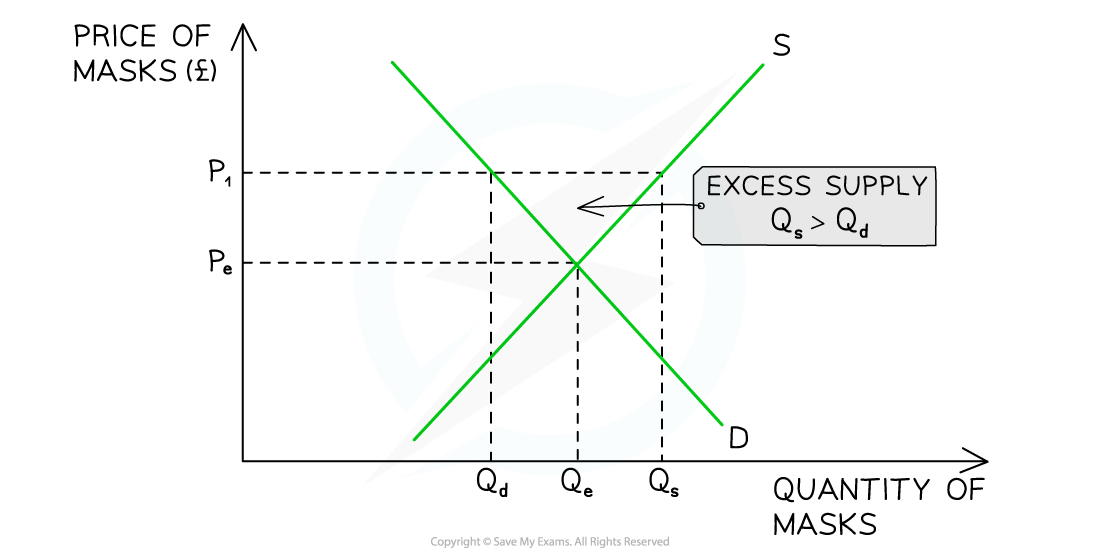
Diagram analysis
At a price of P1, the quantity supplied of face masks (Qs) is greater than the quantity demanded (Qd)
There is a surplus in the market equivalent to QdQs
Market response
This market is in disequilibrium
Sellers are frustrated that the masks are not selling and that the price is obviously too high
Some buyers are frustrated as they want to purchase the masks but are not willing to pay the high price
Sellers will gradually lower prices in order to generate more revenue
This causes a contraction in QS as some sellers no longer desire to supply masks
This causes an extension in QD as buyers are more willing to purchase masks at lower prices
In time, the market will have cleared the excess supply and arrive at a position of equilibrium (PeQe)
Examiner Tips and Tricks
Memorise the rule that shortages arise when the price is below equilibrium whereas surpluses arise when the price is above the equilibrium.
Equilibrium in Demand and Supply Schedules
A demand and supply schedule shows the quantity demanded and the quantity supplied of a product at different price levels
Demand and supply schedules can be used to identify equilibrium and disequilibrium
Demand and Supply Schedule per Week for YEEZY Boost 700 Wave Runner Trainers
Price ($) | Quantity Demanded (QD) | Quantity Supplied (QS) | Excess Demand/Supply |
|---|---|---|---|
300 | 1200 | 500 | Excess demand = 700 |
400 | 1000 | 650 | Excess demand = 350 |
500 | 800 | 800 | Equilibrium |
600 | 600 | 950 | Excess supply = 350 |
700 | 400 | 1100 | Excess supply = 700 |
Table analysis
At a price of $500, the market is in equilibrium
The QD = QS (800 units)
At a price of $300 and $400, there is excess demand as the product is more affordable for consumers
Producers supply less at lower prices as they make less profit per unit
Producers are incentivised to supply more when prices are higher
At a price of $600 and $700, there is excess supply as the high price has eliminated some buyers from the market
Producers would love to sell at this high price but in order to clear their stock they have to lower the price and move towards the equilibrium

Unlock more, it's free!
Join the 100,000+ Students that ❤️ Save My Exams
the (exam) results speak for themselves:

Was this revision note helpful?