Syllabus Edition

First teaching 2025

First exams 2027

Population Structures (Cambridge (CIE) IGCSE Geography): Exam Questions

Exam code: 0460 & 0976

1 hour16 questions
1a1 mark

Study Fig. 1, which shows the age structure of a number of countries.

Age Group

Percentage of Population (%)


Country A

Country B

Country C

Country D

Country E

Country F

65 and over

18.3

4.1

5.5

13.2

3.1

17.3

15-64

63.0

59.1

61.6

70.3

69.3

67.6

0-14

18.7

36.8

32.9

16.5

27.6

15.1

Fig 1

Identify the country with the highest percentage of population aged 65 and over.

1b1 mark

Identify the country with the lowest percentage of dependent population

21 mark

Study Fig. 1.3, which is a population pyramid for the United Arab Emirates (UAE), an MEDC.

q1b-0460-s20-qp-12

Identify three characteristics of the population pyramid for the UAE which suggest that it attracts many migrants.

33 marks

Study Fig 1.2, which shows population pyramids of the structure of Mexico’s population in 1980 and 2010.

q1-1b-0460-w19-qp-13

Describe the changes in Mexico’s population structure between 1980 and 2010.

4a1 mark

Study Fig. 1.1, which shows information about the population structure of Thailand (an LEDC in Southeast Asia) in 1980 and 2015.

fig-1-1-paper12-cie-igcse-geography

Fig. 1.1

How many of the population of Thailand in 1980 were female and aged 0 to 4?

4b2 marks

Describe how the total population of Thailand aged 0 to 4 changed between 1980 and 2015. You should use statistics in your answer.

4c3 marks

Describe how the shape of Thailand’s population pyramid changed between 1980 and 2015.

53 marks

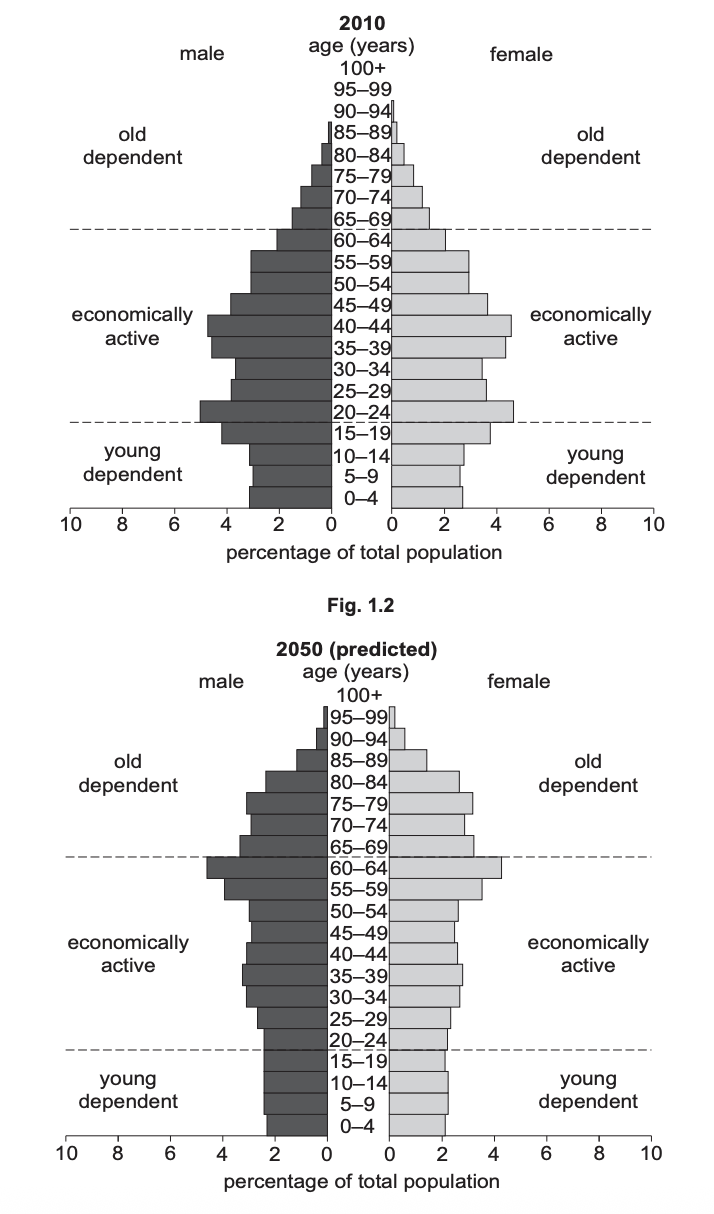
Study Figs. 1.2 and 1.3, which are population pyramids showing the structure of China’s population in 2010 and 2050 (predicted).

Population pyramids comparing age and gender distribution in 2010 and predicted for 2050, showing young, economically active, and old dependents.
Fig 1.2 and 1.3

Describe the changes which are predicted in China’s economically active population between 2010 and 2050.

61 mark

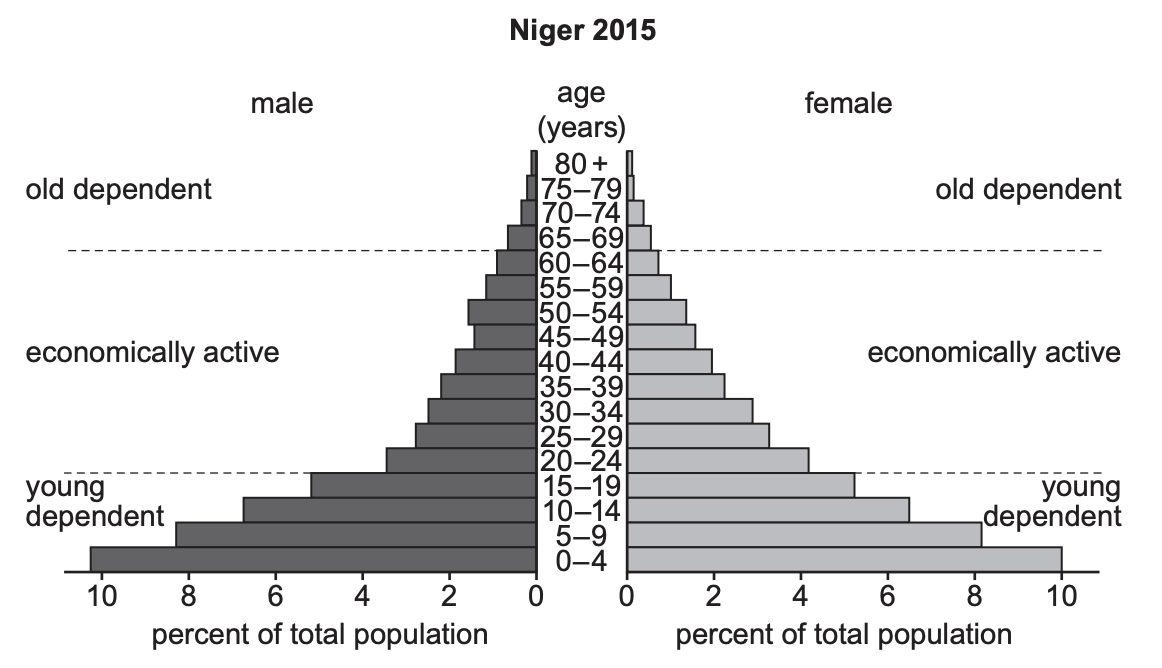
Study Fig. 1.2, which is a population pyramid for Niger (an LIC in Africa) in 2015.

Population pyramid of Niger 2015, showing age distribution. Males on the left, females on the right, with young, economic, and old dependency categories.
Fig 1.1

Describe three features of the population pyramid of Niger which are typical of an LIC.

14 marks

Describe four challenges for people living in countries where population growth rates are high.

25 marks

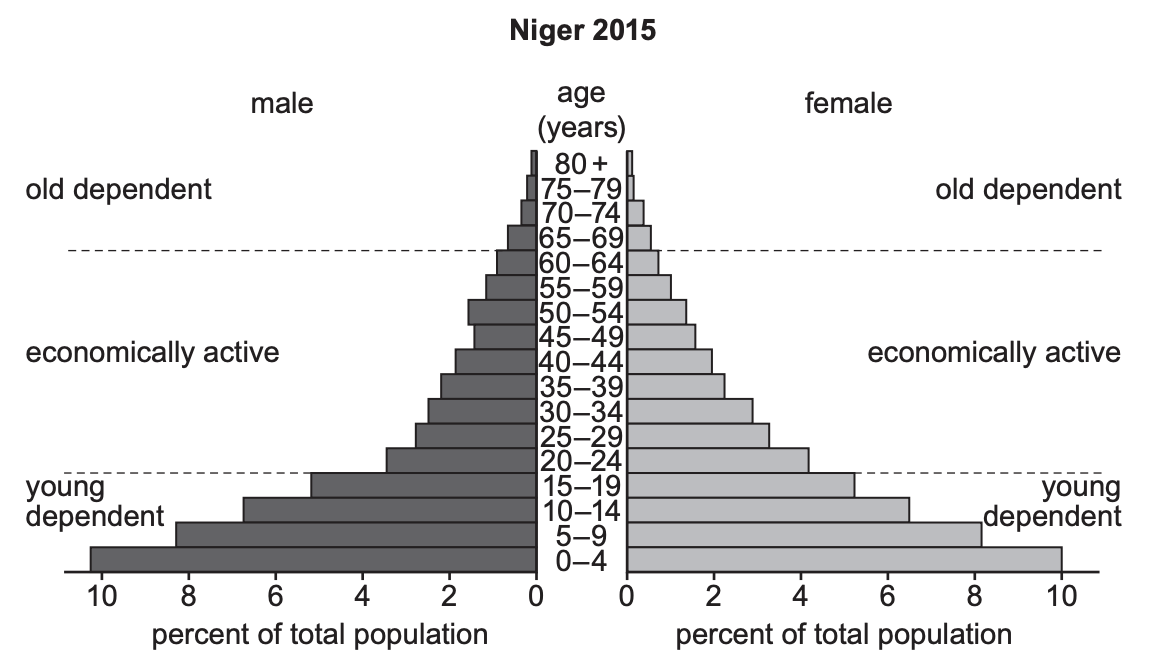
Study Fig. 1.2, which is a population pyramid for Niger (an LIC in Africa) in 2015.

Population pyramid of Niger in 2015 showing age distribution by percentage for males and females, highlighting young and old dependents, economically active.
Fig 1.2

Explain why the proportion of old dependents in an MIC is likely to differ from that of Niger.

34 marks

Study Fig. 1.1, which shows information about the population structure of Thailand (an LEDC in Southeast Asia) in 1980 and 2015.

fig-1-1-paper12-cie-igcse-geography

Fig. 1.1

Suggest reasons for the decrease in the number of young dependents in Thailand between 1980 and 2015.

44 marks

Study Figs. 1.1 and 1.2, which show the population structure for a rural and urban area in Tanzania (an LEDC in Africa).

Fig. 1.1 is the population structure of rural Ifakara.

Fig. 1.2 is the population structure of urban Ifakara.

fig-1-1-paper13-cie-igcse-geography

Fig. 1.1

fig-1-2-paper13-cie-igcse-geography

Fig. 1.2

Suggest reasons why birth rates are high in rural areas of Tanzania.

55 marks

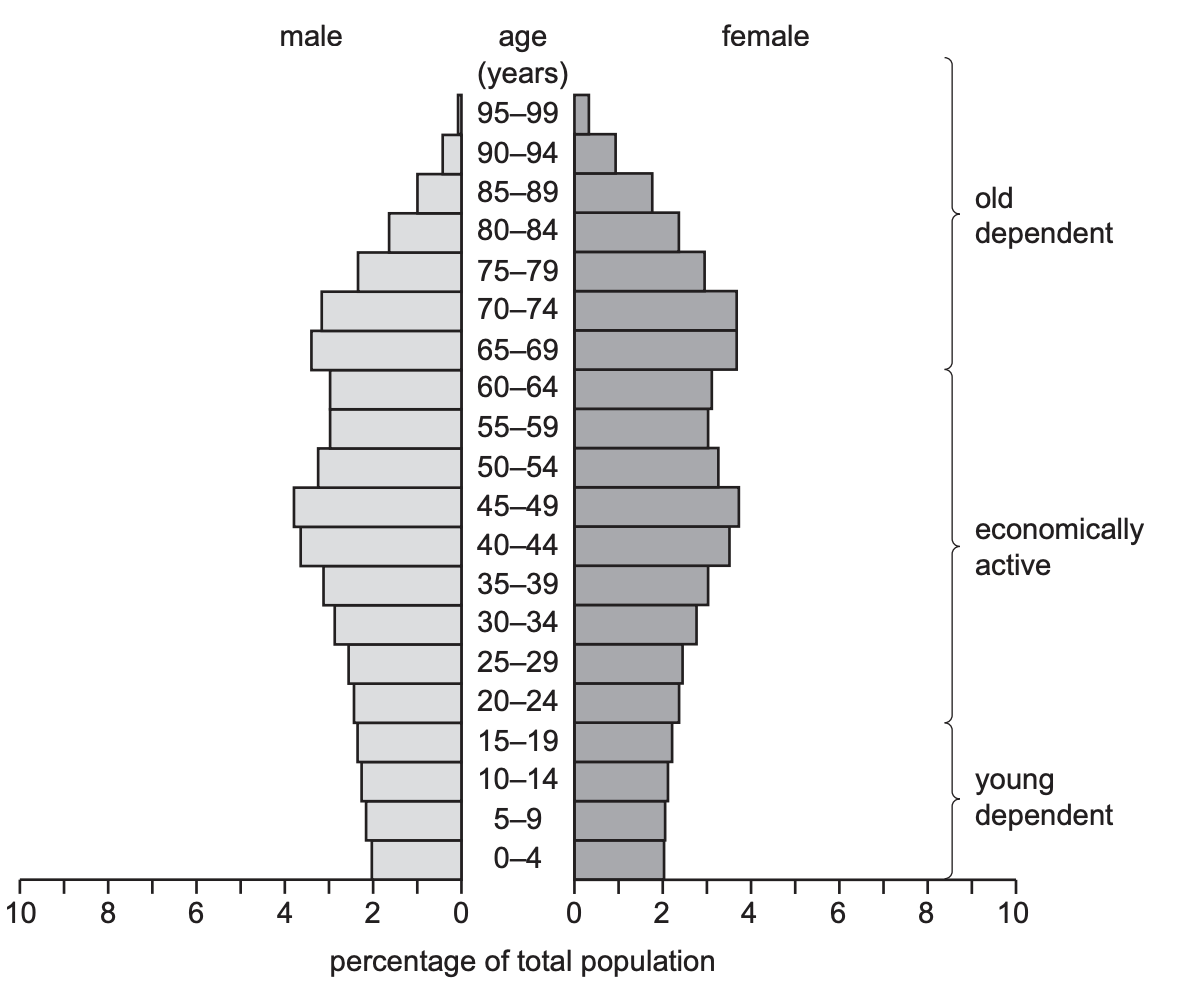
Study Fig. 1.2, which is a population pyramid of Japan (an MIC in Asia).

Population pyramid showing age distribution with males on the left and females on the right, divided into young dependent, economically active, and old dependent groups.
Fig 1.2

Explain why the percentage of young dependents in an LIC is likely to be larger than that of Japan.

17 marks

For a named country you have studied, describe the problems caused by a large dependent population.

21 mark

For a named country you have studied, describe the problems which have been caused by rapid population growth or population decline. 

37 marks

For a named country you have studied, describe and explain the causes of an ageing population. 

47 marks

For a named country you have studied, explain the impacts of having a high youthful dependent population.

57 marks

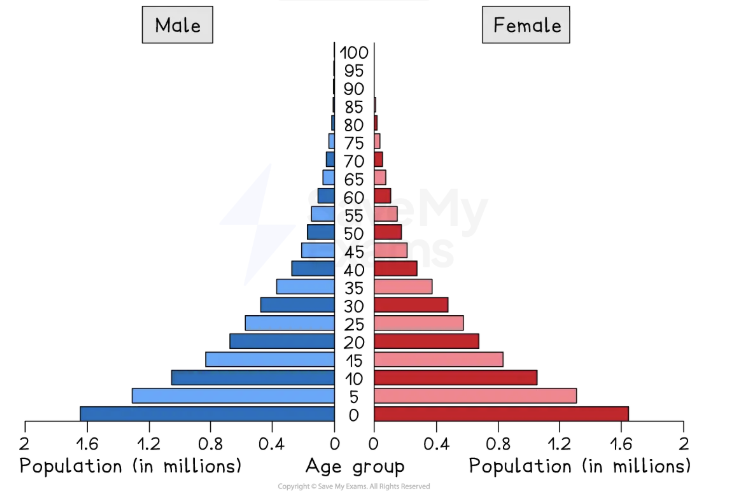
Study Fig 1.1 - Population pyramid showing the age and gender structure of an LIC

Population pyramid showing age distribution by gender; males in blue and females in red; age groups from 0-100; population in millions up to 2.

Using Fig 1.1 explain how the population structure shown will create challenges for the country.