Syllabus Edition

First teaching 2025

First exams 2027

Measuring Development (Cambridge (CIE) IGCSE Geography): Exam Questions

Exam code: 0460 & 0976

38 mins8 questions
1a1 mark

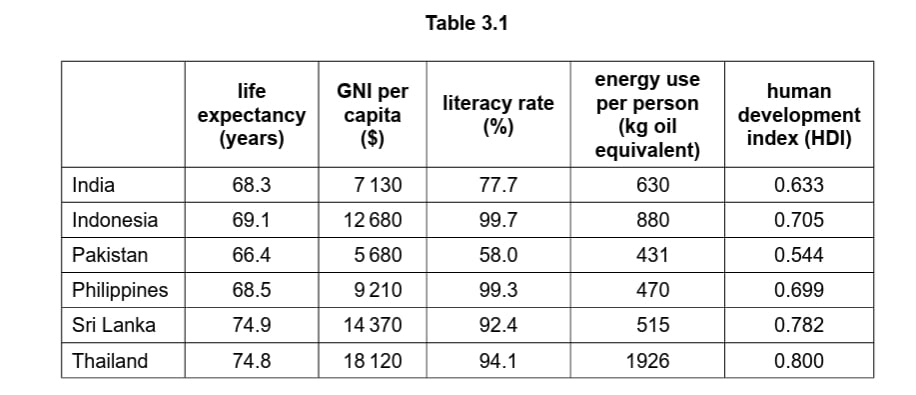
Study Table 3.1, which shows indicators of development for six countries in Asia.

Table comparing life expectancy, GNI per capita, literacy, energy use, and HDI for India, Indonesia, Pakistan, Philippines, Sri Lanka, and Thailand.

Identify one country listed in Table 3.1 with a life expectancy greater than 70 years.

1b2 marks

Define the following terms:

  • GNI per capita

  • Literacy rate

1c3 marks

Study Figure 3.1, a scatter graph showing information about the human development index (HDI) and energy use per person in the six countries listed in Table 3.1.

Graph comparing HDI and energy use per person for six countries: Thailand, Sri Lanka, Indonesia, Philippines, India, and Pakistan.

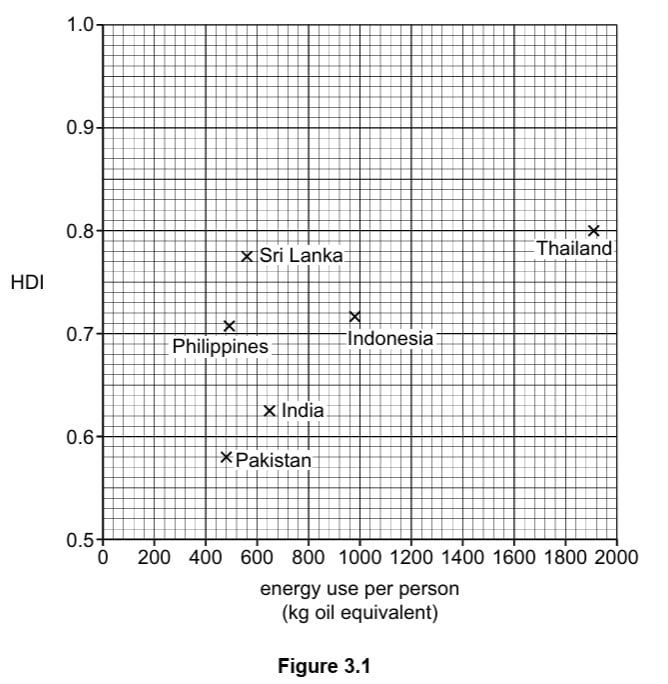
Describe the relationship between HDI and energy use per person. Use data to support your answer.

2a1 mark

Study Fig. 5.1, a map showing the Human Development Index (HDI).

World map showing Human Development Index by country: very high (dark green), high (green), medium (orange), low (red), and no data (grey).

Put the following countries in rank order according to their HDI.

Brazil 


Canada 


China  


Sudan


2b2 marks

Describe the main differences in HDI between North and South America.

2c3 marks

Explain why HDI is a good measure of development.

3a1 mark

Study Fig. 5.1, which shows information about the employment structure of Cameroon, Italy and Japan.

Three pie charts show employment sectors in Cameroon, Italy, and Japan. Key: striped for primary, dotted for secondary, crossed for tertiary.

Give one example of a worker in the tertiary sector.

3b2 marks

Complete the pie graph in Fig. 5.1 to show the following information for Japan:

Secondary employment = 25%

Tertiary employment = 70%

3c3 marks

Describe three differences between the employment structure of Cameroon and Italy.

4a1 mark

Study Fig. 5.1, which is a diagram showing development indicators for four countries.

Radar chart comparing literacy, clean water access, life expectancy, and HDI for Chad, India, Honduras, and Japan. Key indicates line patterns.

Identify the country shown in Fig. 5.1 which has the shortest life expectancy.

4b2 marks

Complete Fig. 5.1 by plotting the following information:

  • 90% of the population of Honduras are literate.

  • The Human Development Index (HDI) of Honduras is 0.63.

4c3 marks

Explain why the Human Development Index (HDI) is a good method of comparing development between countries.

5a1 mark

What do the initials HDI mean?

5b3 marks

Name three indicators which are used to calculate the HDI.

62 marks

Study Fig. 5.1, a map showing the HDI of India’s states. India is an LIC in South Asia.

Map of Indian states showing HDI levels: Kerala has the highest, while states like Rajasthan have lower levels. Colour-coded key indicates HDI ranges.
Fig. 5.1 HDI of India’s states

Using Fig. 5.1, name

a) an Indian state with an HDI of 0.551–0.600

b) a state in the east of India with an HDI of 0.651–0.700.

14 marks

Use Table 3.1 to identify the country which you consider to be the most developed. Justify your answer.

Table comparing life expectancy, GNI per capita, literacy rate, energy use, and HDI for six countries: India, Indonesia, Pakistan, Philippines, Sri Lanka, Thailand.
24 marks

Study Fig. 5.1, a map showing the HDI of India’s states. India is an LIC in South Asia.

Map of India showing states with Human Development Index (HDI) ranges: 0.751-0.800 (blue), 0.701-0.750 (purple), 0.651-0.700 (green), others in orange, pink.
Fig. 5.1 HDI of India’s states

Suggest why some states in India have a higher HDI than other states.