1
3 marks
Study Fig. 5.2, a photograph taken in Mumbai, India.
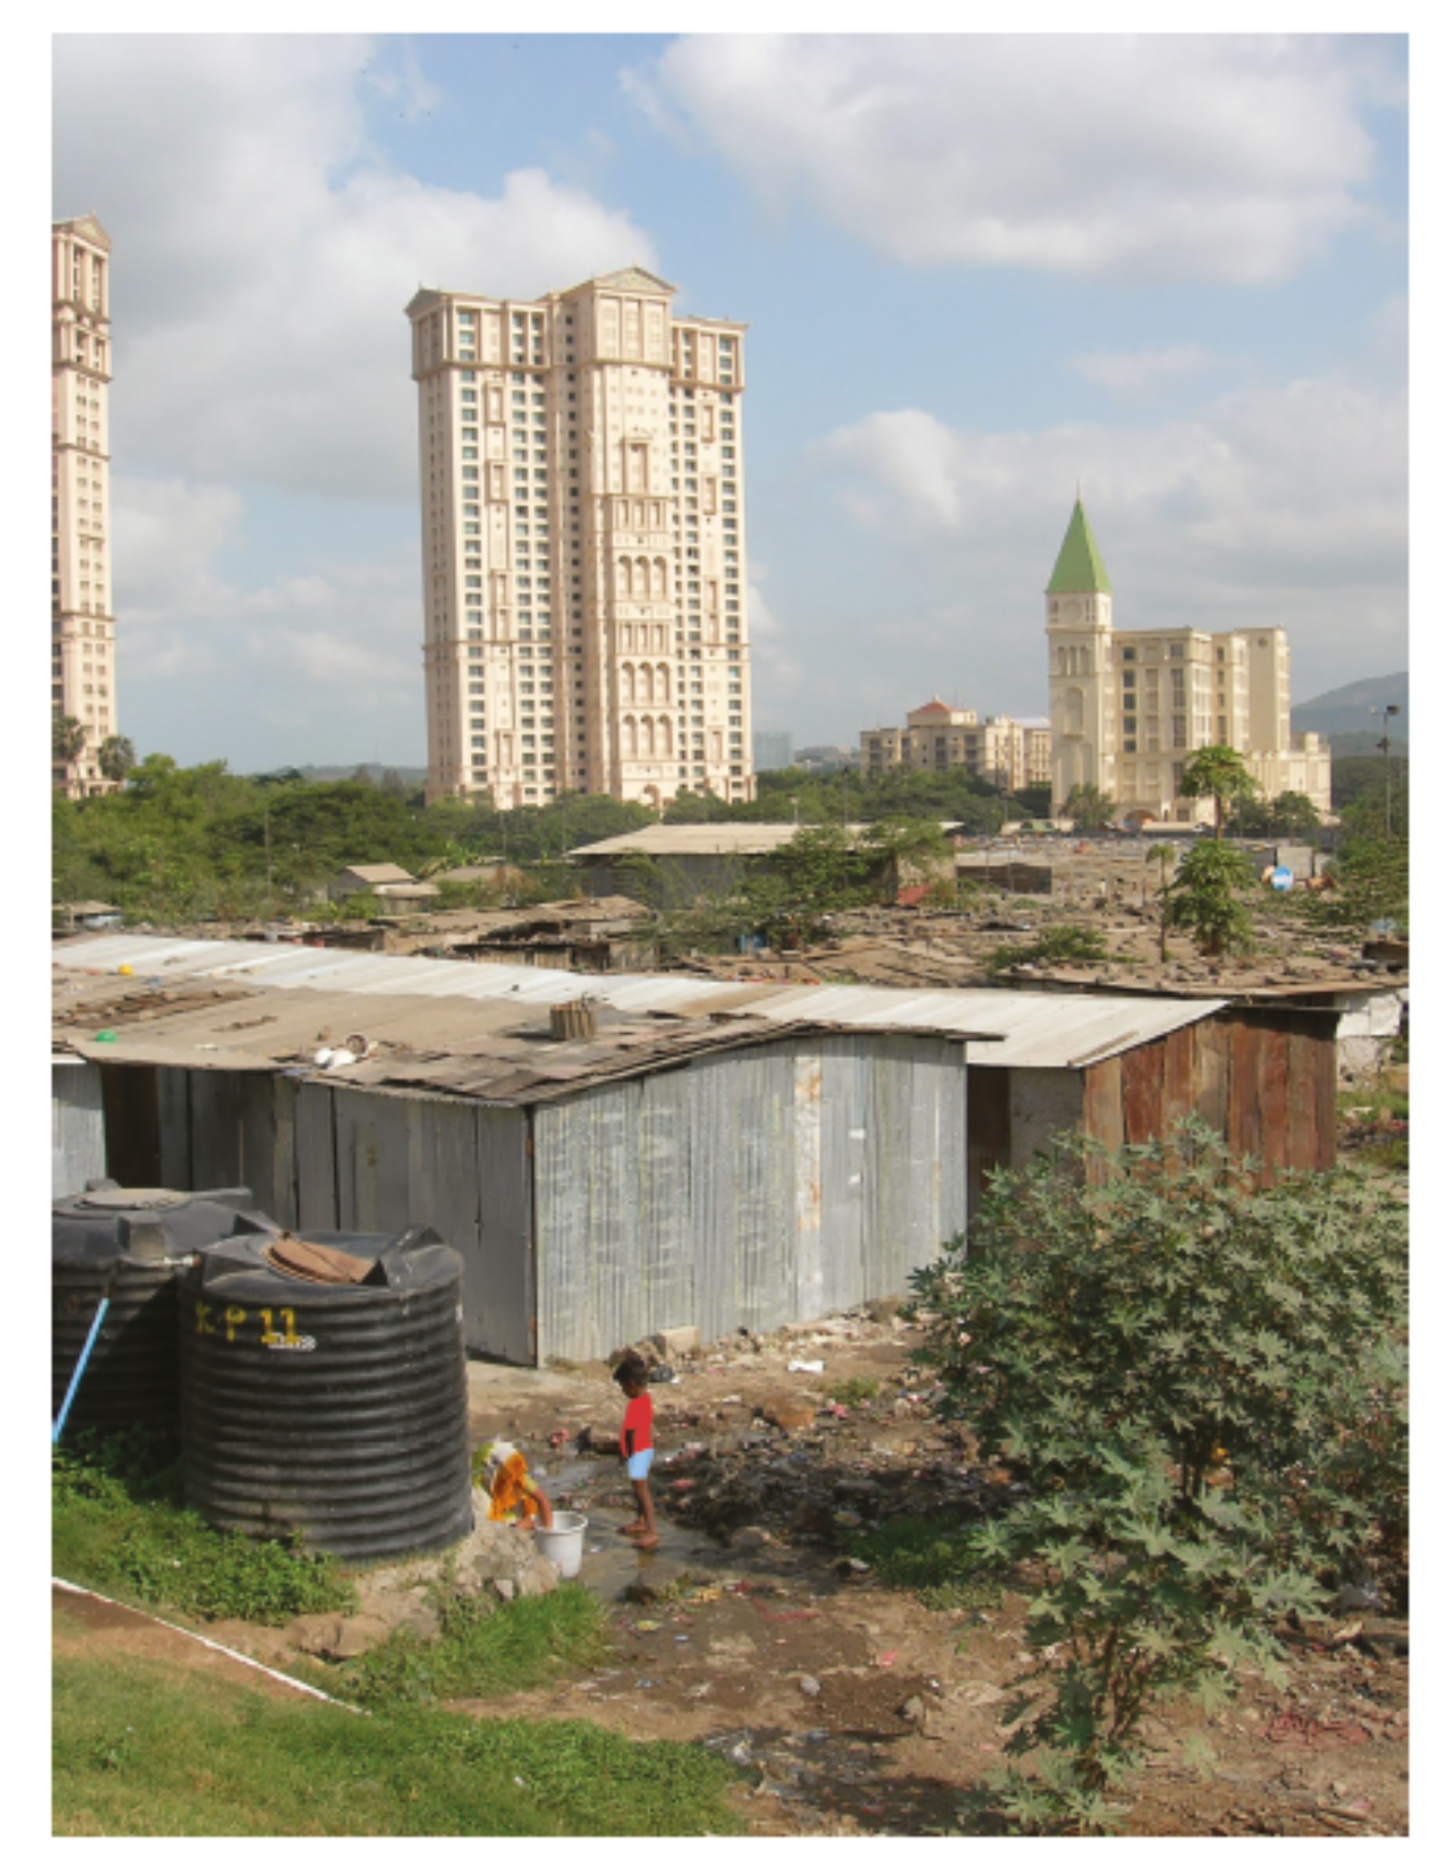
Using evidence from Fig. 5.2, suggest what inequalities exist in Mumbai.
Was this exam question helpful?
Exam code: 0460 & 0976
Syllabus Edition
First teaching 2025
First exams 2027
Study Fig. 5.2, a photograph taken in Mumbai, India.
Using evidence from Fig. 5.2, suggest what inequalities exist in Mumbai.
Was this exam question helpful?
What is meant by the term 'development gap'?
Was this exam question helpful?
Give two environmental reasons why some countries develop more slowly.
Was this exam question helpful?
Identify two features of low-income countries (LICs).
Was this exam question helpful?
Describe three problems caused by the development gap.
Was this exam question helpful?
Study Fig. 5.2, which shows indicators of development for selected countries in Africa.
Country | Life expectancy (years) | Energy use per person (kg of oil equivalent) | Number of doctors (per 100 000 people) | Adult literacy (%) |
|---|---|---|---|---|
Angola | 55 | 606 | 8 | 67 |
Egypt | 73 | 735 | 212 | 58 |
Ethiopia | 61 | 299 | 3 | 43 |
Kenya | 64 | 494 | 13 | 85 |
South Africa | 50 | 2587 | 69 | 87 |
Tanzania | 61 | 465 | 2 | 78 |
Uganda | 54 | 776 | 5 | 70 |
Fig. 5.2
Identify the country which:
Has the lowest percentage of people who can read and write.
Is likely to have the poorest access to a doctor.
Has the lowest energy use per person.
Was this exam question helpful?
Explain why there may be inequalities in levels of development within a country.
Was this exam question helpful?
Explain why there are inequalities in wealth between countries.
Was this exam question helpful?
Study Fig. 5.2, which shows indicators of development for selected countries in Africa.
Country | Life expectancy (years) | Energy use per person (kg of oil equivalent) | Number of doctors (per 100 000 people) | Adult literacy (%) |
|---|---|---|---|---|
Angola | 55 | 606 | 8 | 67 |
Egypt | 73 | 735 | 212 | 58 |
Ethiopia | 61 | 299 | 3 | 43 |
Kenya | 64 | 494 | 13 | 85 |
South Africa | 50 | 2587 | 69 | 87 |
Tanzania | 61 | 465 | 2 | 78 |
Uganda | 54 | 776 | 5 | 70 |
Fig. 5.2
Which country, listed in Fig. 5.2, do you consider to have the highest level of development?
Justify your answer.
Was this exam question helpful?
Explain how being landlocked can affect a country’s development.
Was this exam question helpful?
Describe two social factors that can widen the development gap.
Was this exam question helpful?
Suggest one reason why some countries move from LIC to MIC status.
Was this exam question helpful?
Explain one reason why classifying countries only by income can be misleading.
Was this exam question helpful?
Assess how environmental factors can contribute to uneven development.
Was this exam question helpful?
Evaluate the role of colonial history in creating uneven development today.
Was this exam question helpful?
Assess the extent to which social factors explain uneven development between countries?
Was this exam question helpful?
Assess why global classifications of LICs, MICs, and HICs are often contested.
Was this exam question helpful?
Evaluate how economic factors widen the development gap between LICs and HICs.
Was this exam question helpful?
Assess how the choice of development indicators can affect how the global development gap is understood.
Was this exam question helpful?