Syllabus Edition

First teaching 2025

First exams 2027

Earthquakes & Volcanoes (Cambridge (CIE) IGCSE Geography): Exam Questions

Exam code: 0460 & 0976

54 mins16 questions
1a1 mark

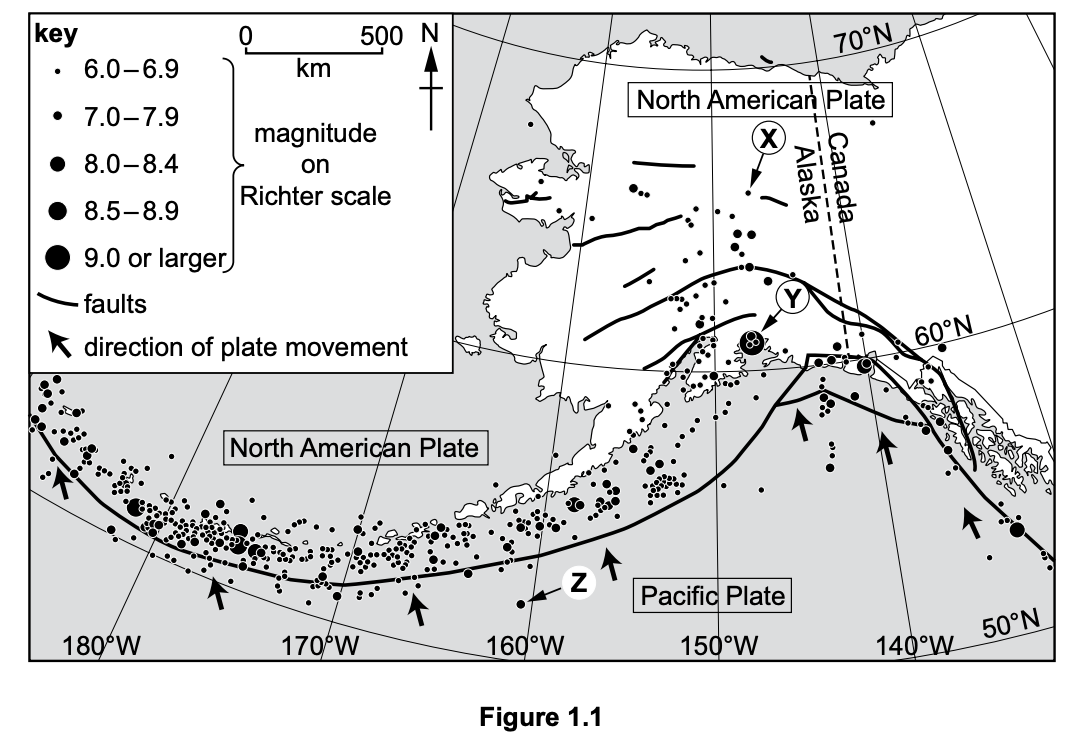
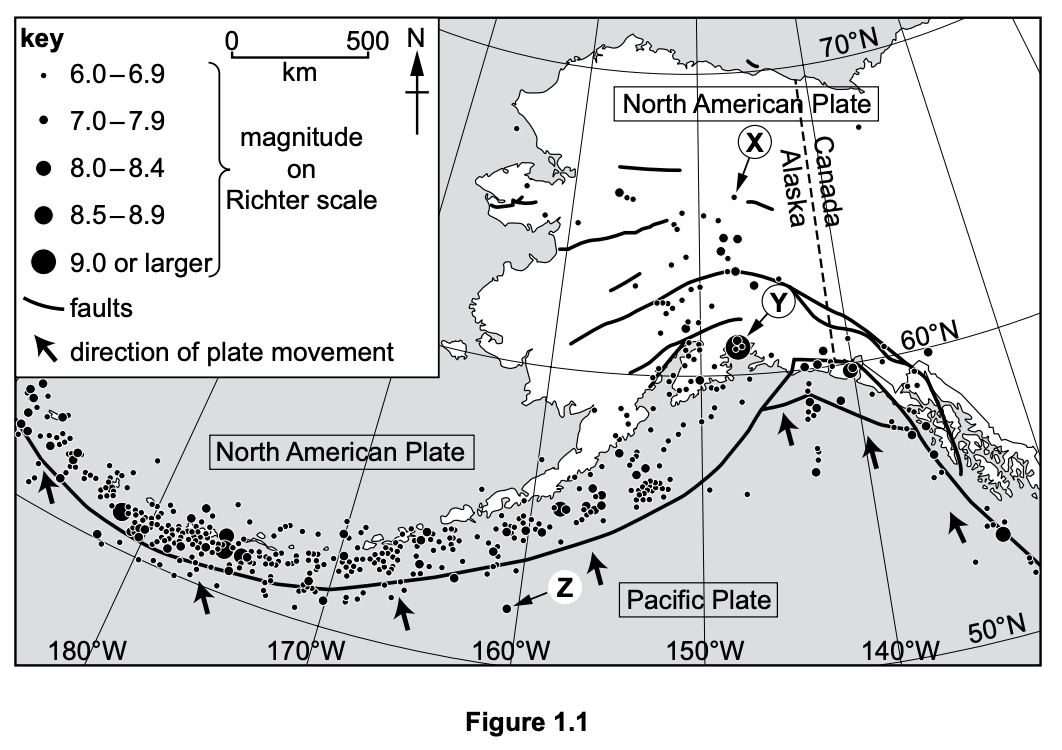
Study Figure 1.1, a map showing the location and magnitude of earthquakes in Alaska, USA.

Map showing earthquake magnitudes and tectonic plates in Alaska. Includes faults, plate boundaries, and movement directions on the Richter scale.

In which direction is the Pacific Plate moving?

  • north (N)

  • north-north-west (NNW)

  • north-west (NW)

  • south-east (SE)

  • south-south-east (SSE)

1b1 mark

State the latitude and longitude of the earthquake labelled X in Figure 1.1

23 marks

Figure 1.2 shows the location of Whakaari, New Zealand, where a volcano erupted in 2019.

Map showing Bay of Plenty and Taupo Volcanic Zone in New Zealand, featuring Whakaari and Moutohorā volcanoes, with Whakatāne town nearby.

Use Figure 1.2 to describe the location of Whakaari.

31 mark

Study Fig 1, which shows the distribution of earthquakes

q1-2-1-paper-1-cie-igcse-geography-tqs

State the type of plate boundary at X 

41 mark

Study Fig. 3.1, which shows three different types of plate boundary.

q3a-0460-s20-qp-11

Which diagram, A, B or C, shows a conservative plate boundary?

[1]

52 marks

Shield volcanoes are often formed on constructive (divergent) plate boundaries. Describe two characteristics of a shield volcano.

61 mark

Study Fig 1.1, which shows an earthquake at a plate boundary.

Diagram of tectonic plates showing an earthquake focus at point X, seismic wave circles, plates A and B, trees, a car, buildings, and plate movement direction.
Fig 1.1

Identify the features labelled X, Y and Z on Fig 1.1.

73 marks

Study Fig. 3.2, which is a map showing information about earthquakes which caused more than 10 000 deaths in different parts of the world (1900-2011).

World map showing locations of earthquakes causing over 10,000 deaths, marked by circles, along major plate boundaries indicated by lines. Key included.
Fig 3.2

The distribution of earthquakes is uneven. Describe the distribution of the areas where earthquakes caused more than 10 000 deaths between 1900 and 2011.

8a1 mark

Study Fig. 4.1, which is a map of earthquakes in part of South America in the 21st century.

Map showing earthquake focal depths in Chile and Argentina, along the Nazca and South American Plate boundary, with directional arrows and a colour-coded key.
Fig 4.1

Define the term depth of focus?

8b2 marks

Describe how the depth of focus of the earthquakes shown in Fig. 4.1 changes along line A–B. Use data in your answer.

8c1 mark

Explain why the depth of focus changes from A to B in Fig. 4.1.

93 marks

Study Fig 1, which shows the location of earthquakes and their magnitude

q1-2-1-paper-2-medium-cie-igcse-geography-tqs-

Figure 1 – A Map showing the location of earthquakes and their magnitude

Describe the distribution of earthquakes shown in Figure 1

14 marks

Describe the distribution of earthquakes shown in Figure 1.1.

Map of Alaska showing earthquake magnitudes, fault lines, and plate movements on the Richter scale between the North American and Pacific plates.
25 marks

Figure 1.3 shows information about a volcanic eruption on Whakaari.

Cross-section diagram of a volcanic eruption showing ash, gases, lava, and volcanic bombs with labelled tectonic plates and subduction zone beneath.

Use Figure 1.3 to explain why a volcanic eruption occurred on Whakaari.

34 marks

Explain how an earthquake occurs at a conservative plate margin

44 marks

The strongest earthquake in history was at Bio-Bio in Chile, in 1960, with a magnitude of 9.5. The location of Bio-Bio is shown in Fig. 3.1.

q3a-0460_w20_qp_21

Using evidence from Fig. 3.1, explain the cause of the Bio-Bio earthquake.

53 marks

Study Fig 1.1, which shows an earthquake at a plate boundary.

Seismic illustration showing concentric circles from point X, depicting plate movement from Plate A to Plate B, with trees, car, and cityscape above.
Fig 1.1

Explain why earthquakes occur at plate boundaries, such as the one shown in Fig 1.1.

17 marks

Explain why an earthquake occurred in a detailed specific example you have studied.

Name of detailed specific example.....................................................................

27 marks

Explain why a volcanic eruption occurred in a detailed specific example you have studied.

Name of detailed specific example.....................................................................