Using Logarithms When Investigating Bacteria (AQA AS Biology): Revision Note
Exam code: 7401

Using logarithms when investigating bacteria
Bacterial colonies can grow at rapid rates when in culture, with very large numbers of bacteria produced within hours
Dealing with the experimental data relating to large numbers of bacteria can be difficult when using traditional linear scales
There is a wide range of very small and very large numbers
This makes it hard to work out a suitable scale for the axes of graphs
Logarithmic scales can be very useful when investigating bacteria
Orders of magnitude
Logarithmic scales allow for a wide range of values to be displayed on a single graph
An order of magnitude means a tenfold (×10) change in quantity
When you're working with logarithmic scales, especially base 10 (log₁₀), each unit step represents one order of magnitude
Example: yeast cells
Yeast cells were grown in culture over several hours. The number of cells increased very rapidly from the original number of cells present
The results from the experiment are shown in the graph below, using a log scale
The number of yeast cells present at each time interval was converted to a logarithm before being plotted on the graph
The log scale is easily identifiable as there are not equal intervals between the numbers on the y-axis
The wide range of cell numbers fits easily onto the same scale

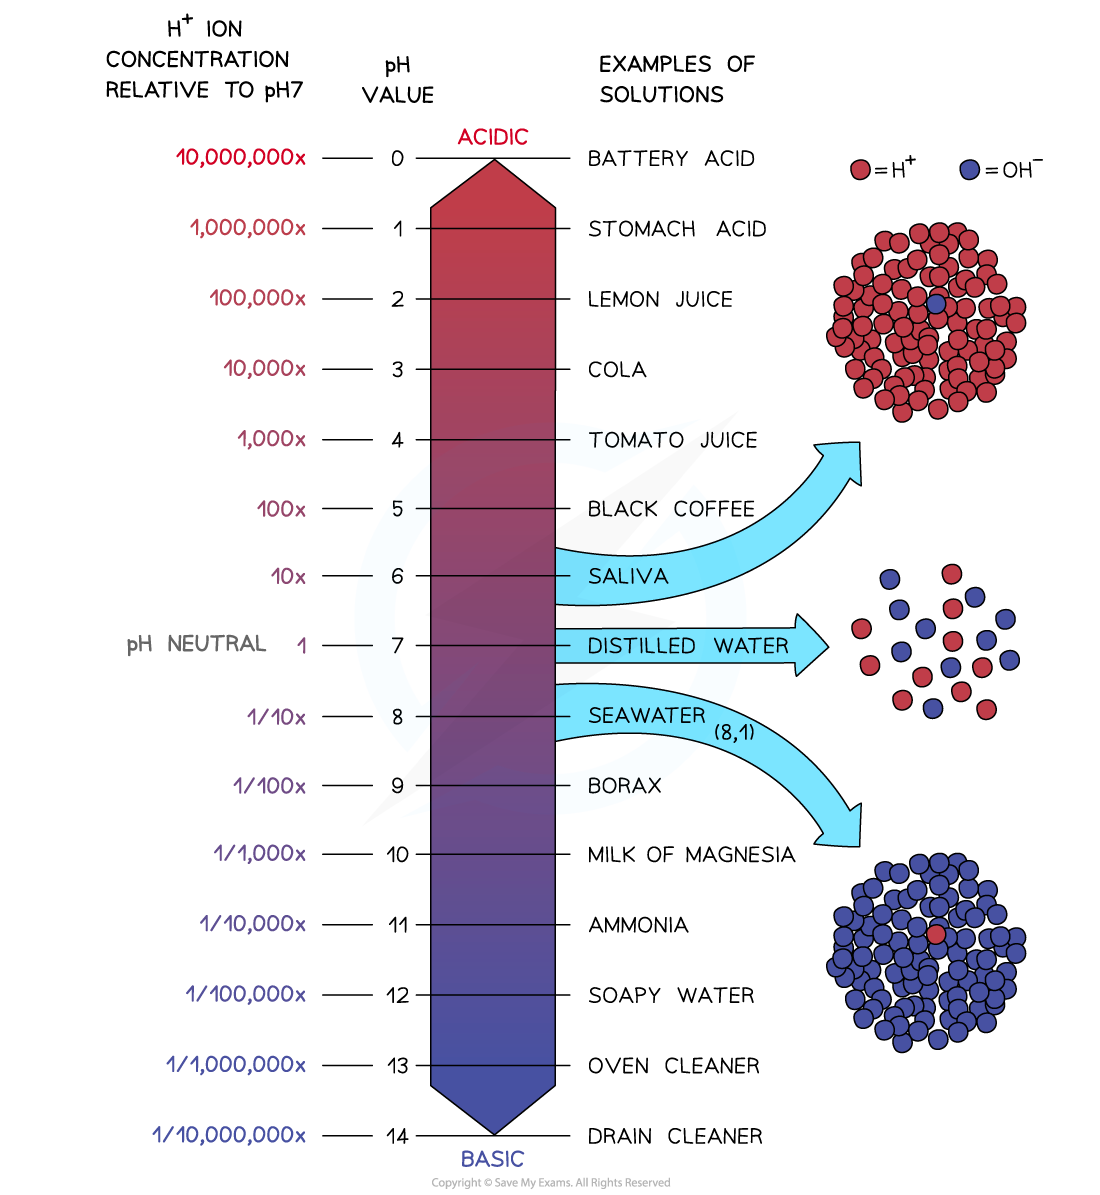
Example: pH scale
The pH scale is logarithmic
The concentration of hydrogen ions varies massively between each pH level
Examiner Tips and Tricks
You won’t be expected to convert values into logarithms or create a log scale graph in the exam. Instead, you might be asked to interpret results that use logarithmic scales or explain the benefit of using one. Remember that graphs with a logarithmic scale have uneven intervals between values on one or more axes.

Unlock more, it's free!
Join the 100,000+ Students that ❤️ Save My Exams
the (exam) results speak for themselves:

Was this revision note helpful?
