Calculating Gradients (AQA GCSE Chemistry): Revision Note
Exam code: 8462

Written by: Stewart Hird
Updated on
Calculating gradients
Higher tier only
Often a curved graph is obtained or a graph which starts out as a straight line but then curves to form a horizontal line as the reaction peters out, usually due to one of the reactants running out
The curved section signifies that the relationship between rate and the factor being measured is not directly proportional, so the rate of reaction is different along each point of the curve
For a curve graph a tangent must be drawn to calculate the change in x and y so the rate of reaction at a particular point during the reaction can be calculated
Place a ruler on the point being studied and adjust its position so the space on either side of the point between the ruler and curve are equal:
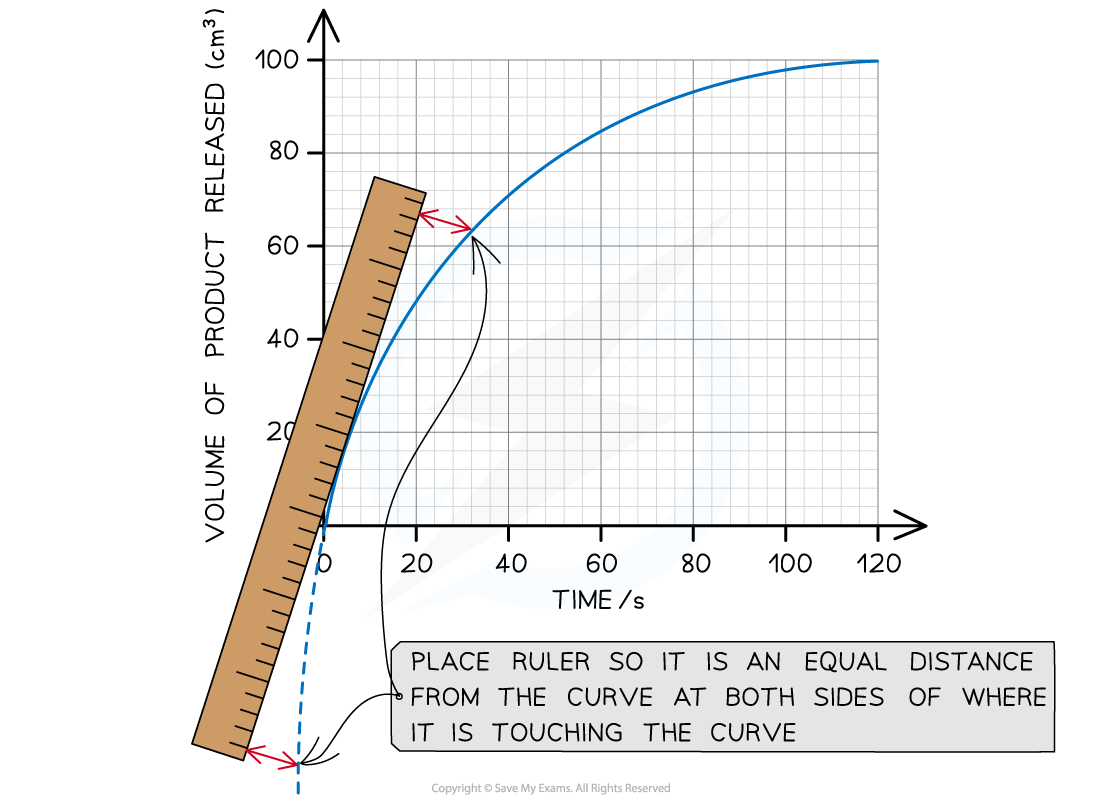
Drawing a tangent to a curve using a ruler
Use the tangent to calculate the rate of reaction as shown below:

Obtaining a tangent on a curve
The gradient at that point is:
gradient = ![]()
You can use this formula to calculate the gradient at any particular point in the curve
Examiner Tips and Tricks
When drawing a tangent:
Use a ruler and pencil to draw a perfectly straight line that just touches the curve at the chosen point. Make sure the curve remains visible (not hidden under the ruler).
The line should be extended as far as is convenient for you to perform the calculations. Extending the tangent in this way decreases the amount of uncertainty.
To calculate the gradient, remember this handy phrase:
"Rise over run" – divide the vertical change by the horizontal change.
Worked Example
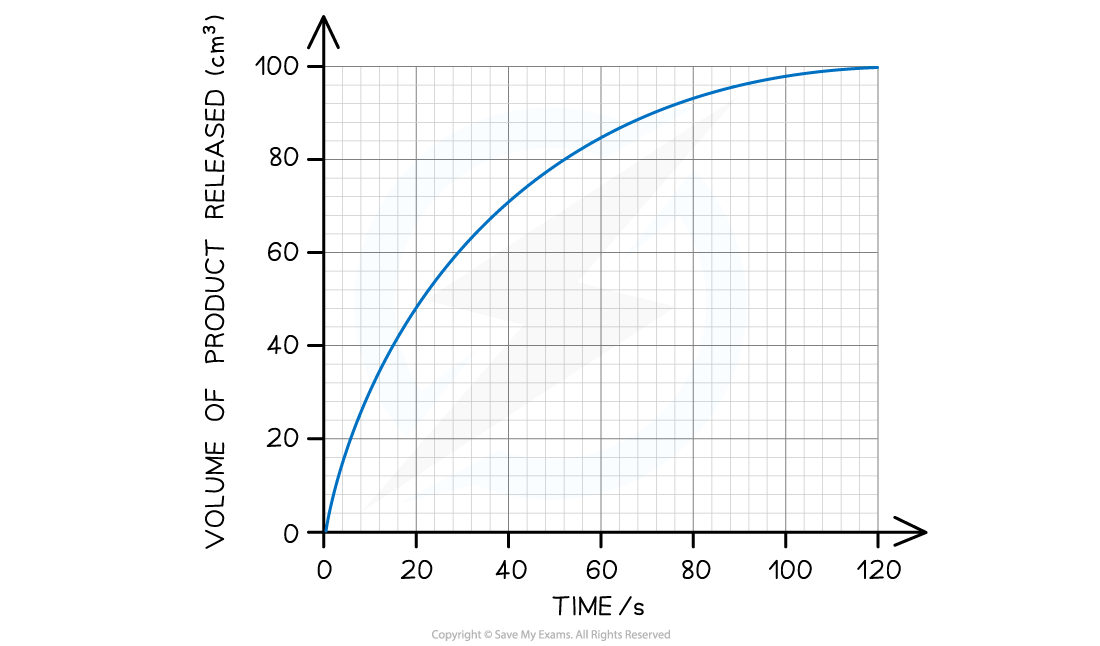
The graph below shows the results of a reaction. Using this graph, calculate the initial rate of reaction.
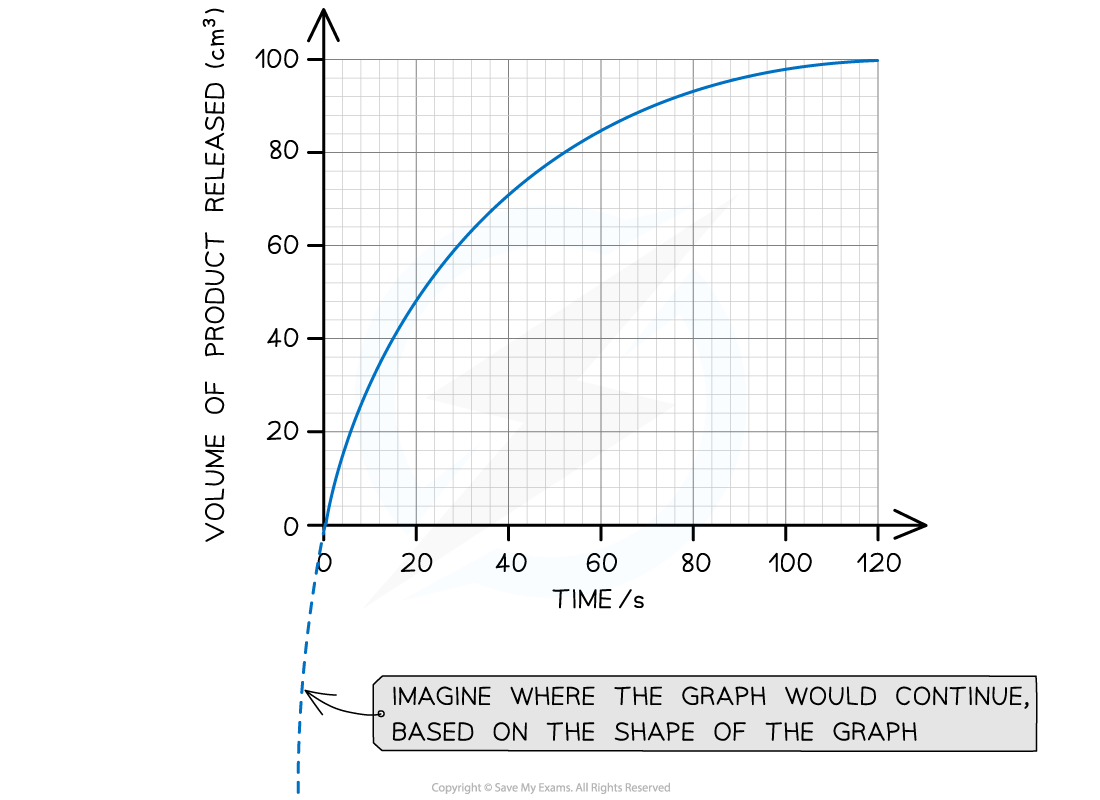
Step 1: Estimate the extrapolated curve of the graph
Step 2: Find the tangent to the curve at 0 seconds (the start of the reaction)
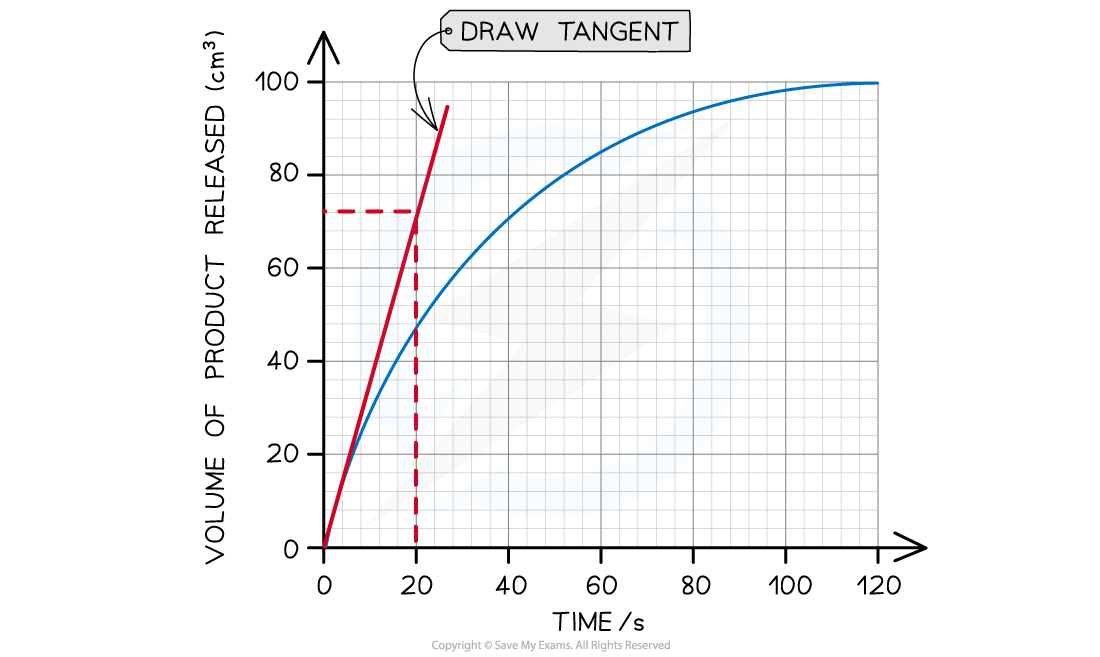
The tangent drawn in the graph above shows that 72 cm3 of product was produced in the first 20 seconds.
Step 3: Calculate the gradient of the tangent (this will give you the initial rate of reaction):
Gradient = change in y-axis ÷ change in x-axis
Initial rate of reaction = 72 cm3 ÷ 20 s
Initial rate of reaction = 3.6 cm3 s-1

Unlock more, it's free!
Join the 100,000+ Students that ❤️ Save My Exams
the (exam) results speak for themselves:

Was this revision note helpful?