Syllabus Edition

First teaching 2025

First exams 2027

Mathematical Skills (Cambridge (CIE) IGCSE Geography): Exam Questions

Exam code: 0460 & 0976

13 mins5 questions
11 mark

Study Fig. 1.1, which shows information about birth rates and death rates in Mexico (an LIC) between 1900 and 2060 (estimated).

Graph showing birth and death rates per 1000 from 1900 to 2060. Birth rate peaks mid-century, then declines. Death rate decreases steadily.
Fig. 1.1

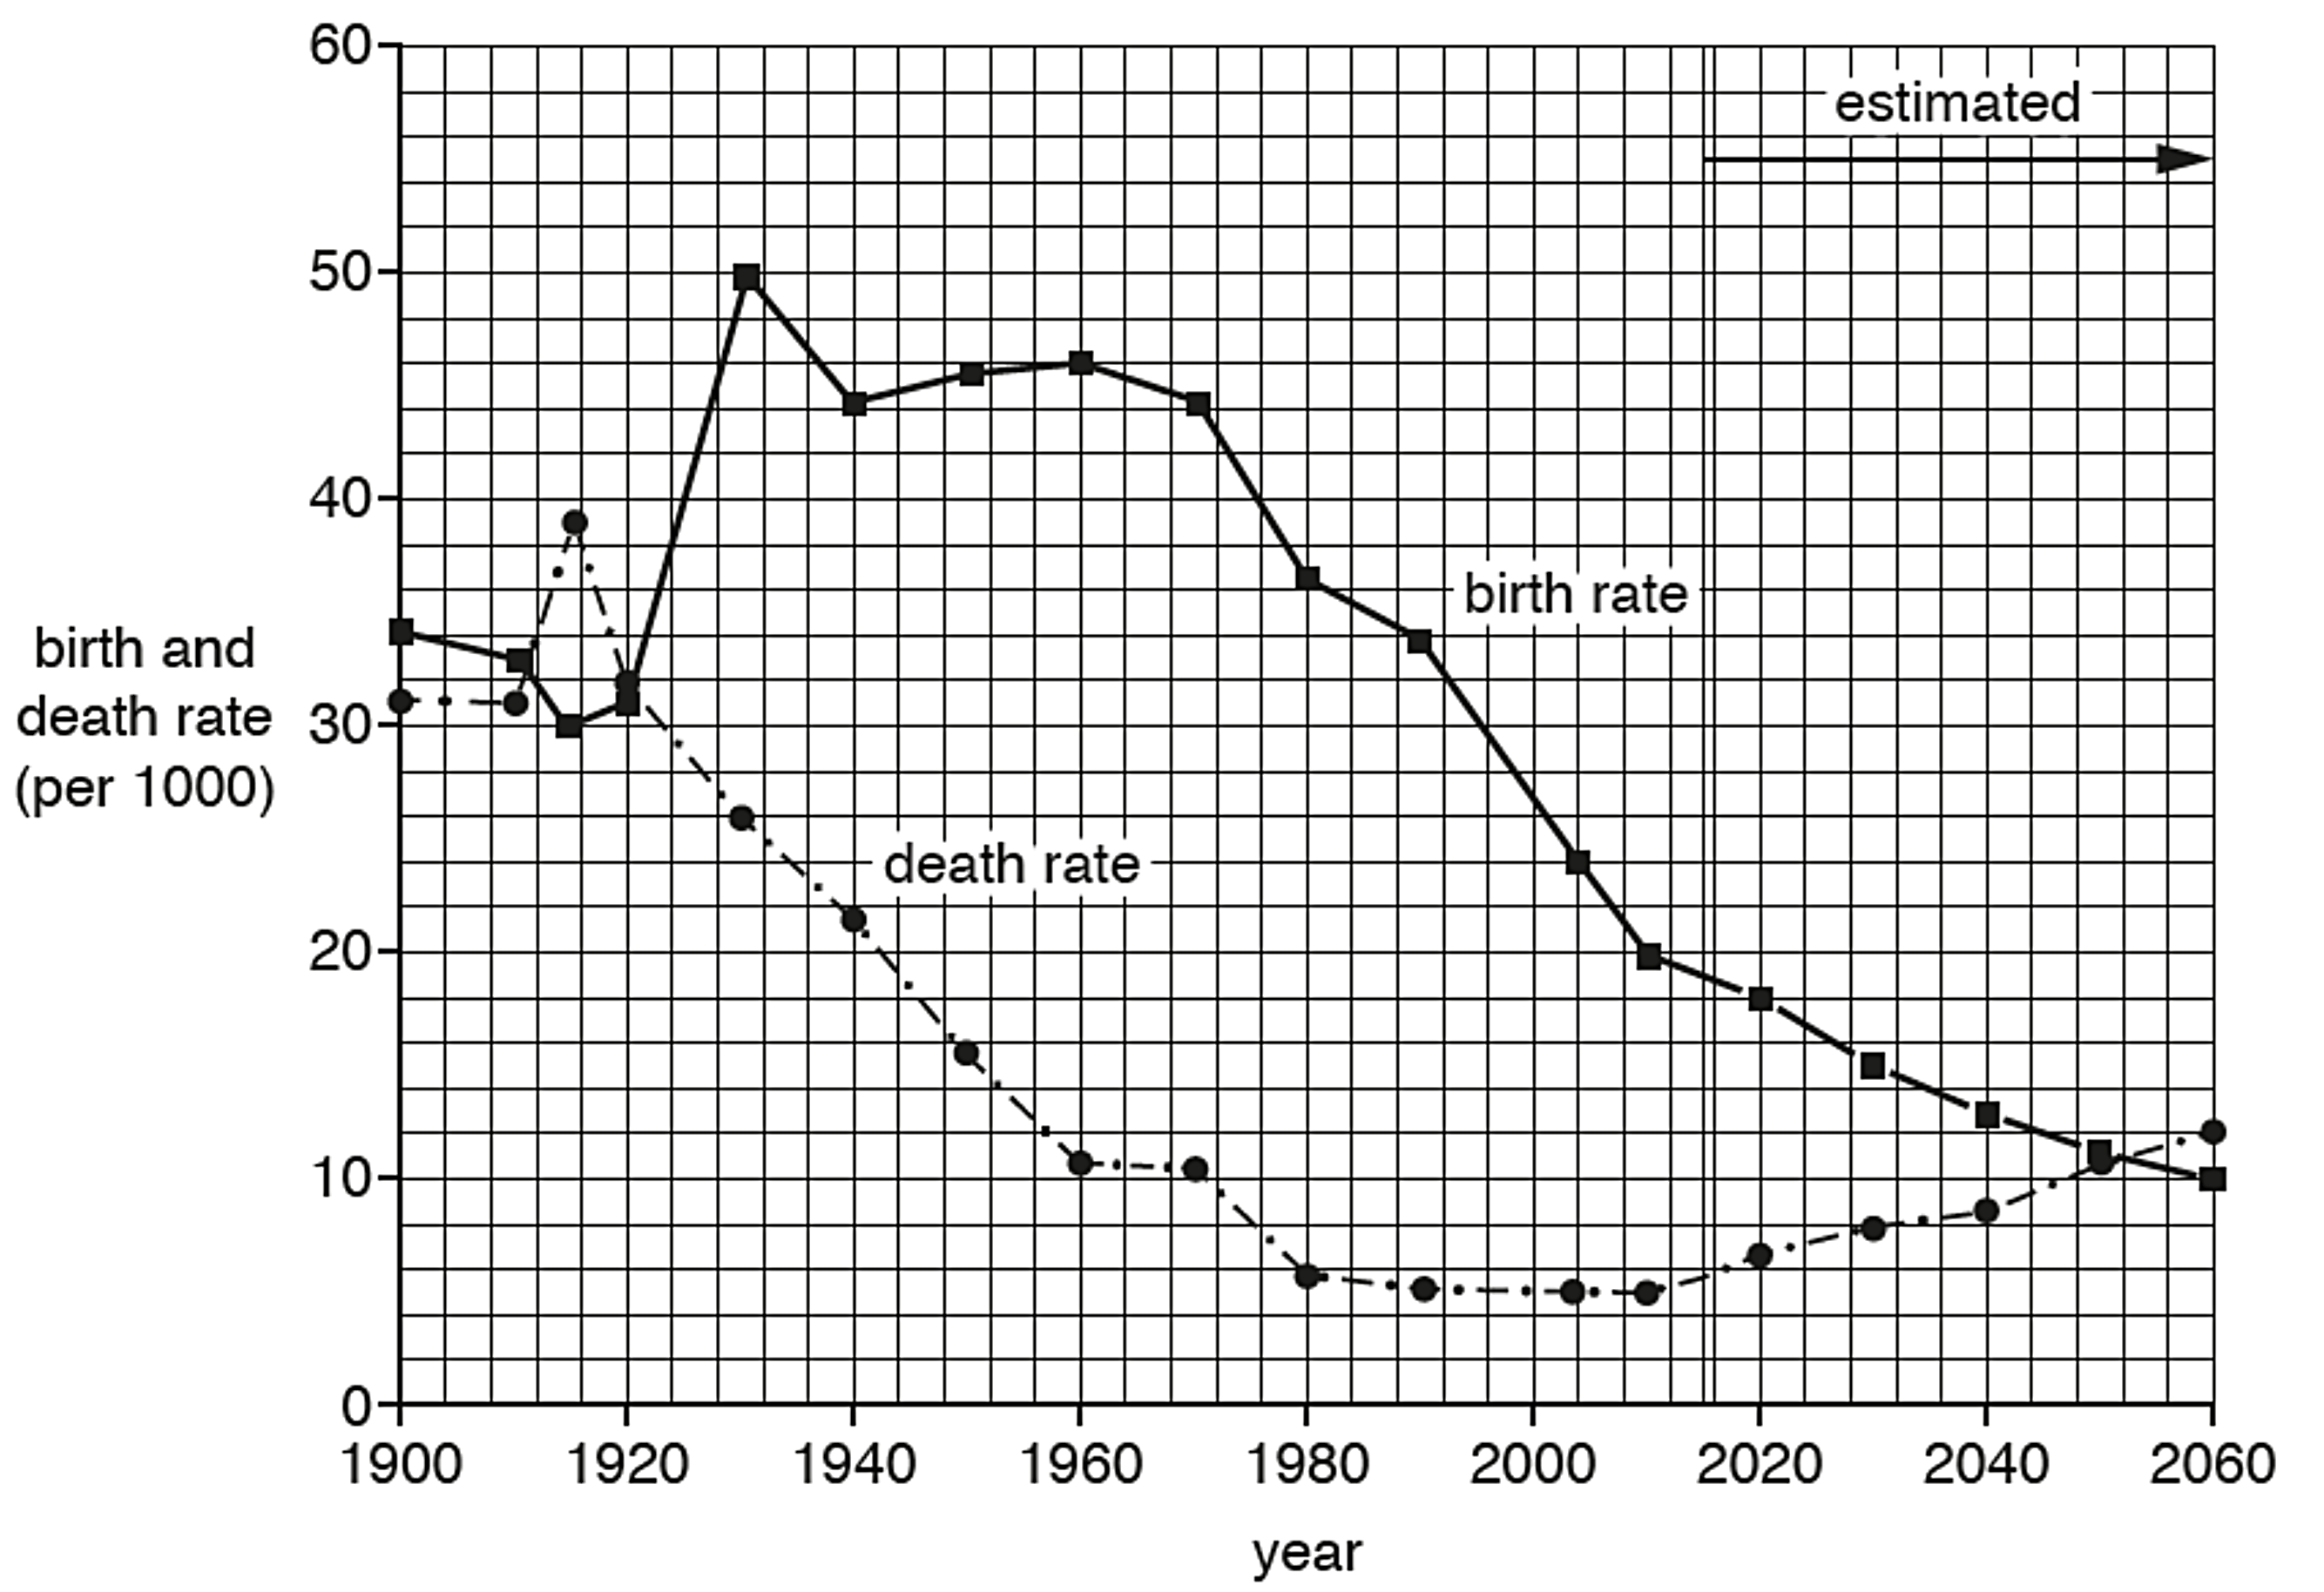
Calculate the natural population growth rate of Mexico in 2010.

You should show your calculations.

23 marks

Fig. 1.1 shows the number of international tourists visiting Singapore during 2018.

Line graph showing monthly variations in international tourists visiting Singapore in 2018, ranging from 1.4 to 1.8 million.
Fig. 1.1

Describe the variation in the number of international tourists during the year.

Use statistics in your answer.

31 mark

Students were studying how a river changes downstream. The students calculated the average depth of the river. Table 2.1 shows the depth of the river at the different measuring points across the channel at site 3.

Table of Site 3 measurements showing depth in metres at measuring points 1 to 10, with values ranging from 0.1 to 0.8 metres.
Table 2.1

Use the results in Table 2.1 to calculate the average depth at site 3.

14 marks

Fig. 2.1 shows the annual population growth rate of Burundi, Africa, between 1961 and 2019.

Line graph showing annual population growth rate (%) from 1961 to 2019, fluctuating between 1.0% and 3.2% with peaks around 1970, 1985, and 2005.
Fig. 2.1

Using Fig. 2.1, describe the overall pattern of the annual population growth rate between 1961 and 2019.

Use statistics in your answer.

24 marks

Deforestation in Country Y has increased from 8,000 km² in 2000 to 12,000 km² in 2010.

Calculate the percentage increase of deforestation in Country Y.

Show your workings.