Syllabus Edition

First teaching 2025

First exams 2027

Food Production (Cambridge (CIE) IGCSE Geography): Exam Questions

Exam code: 0460 & 0976

17 mins5 questions
13 marks

Study Fig. 6.3, which shows recommendations which agricultural experts have given to subsistence farmers in areas such as the one shown in Fig. 6.1.

Recommendation 1

Build a covered, concrete-lined well close to the farm.

Recommendation 2

Put electric fences around the fields of maize and millet.

Recommendation 3

Use some of the land to graze a small herd of goats.

Fig. 6.3

(i)

Explain how each of the three recommendations in Fig. 6.3 may increase the farmers’ food supply.

   -Build a covered, concrete-lined well close to the farm

   -Put electric fences around the fields of maize and millet

   -Use some land to graze a small herd of goats

23 marks

Study Fig. 6.3, which shows information about grain production in Brazil between 1990 and 2014.

qp-6b-0460-w19-qp-11

Compare the change in grain production in Brazil with the change in the area of land planted with grain and harvested between 1990 and 2014.

You should refer to years and use statistics in your answer.

33 marks

Study Fig. 5.2, which is a graph showing information about the world production of wheat and rice between 1980 and 2013.

q5-5b-0460-w19-qp-13

Compare the world production of wheat and rice between 1980 and 2013. You should use statistics in your answer.

4a1 mark

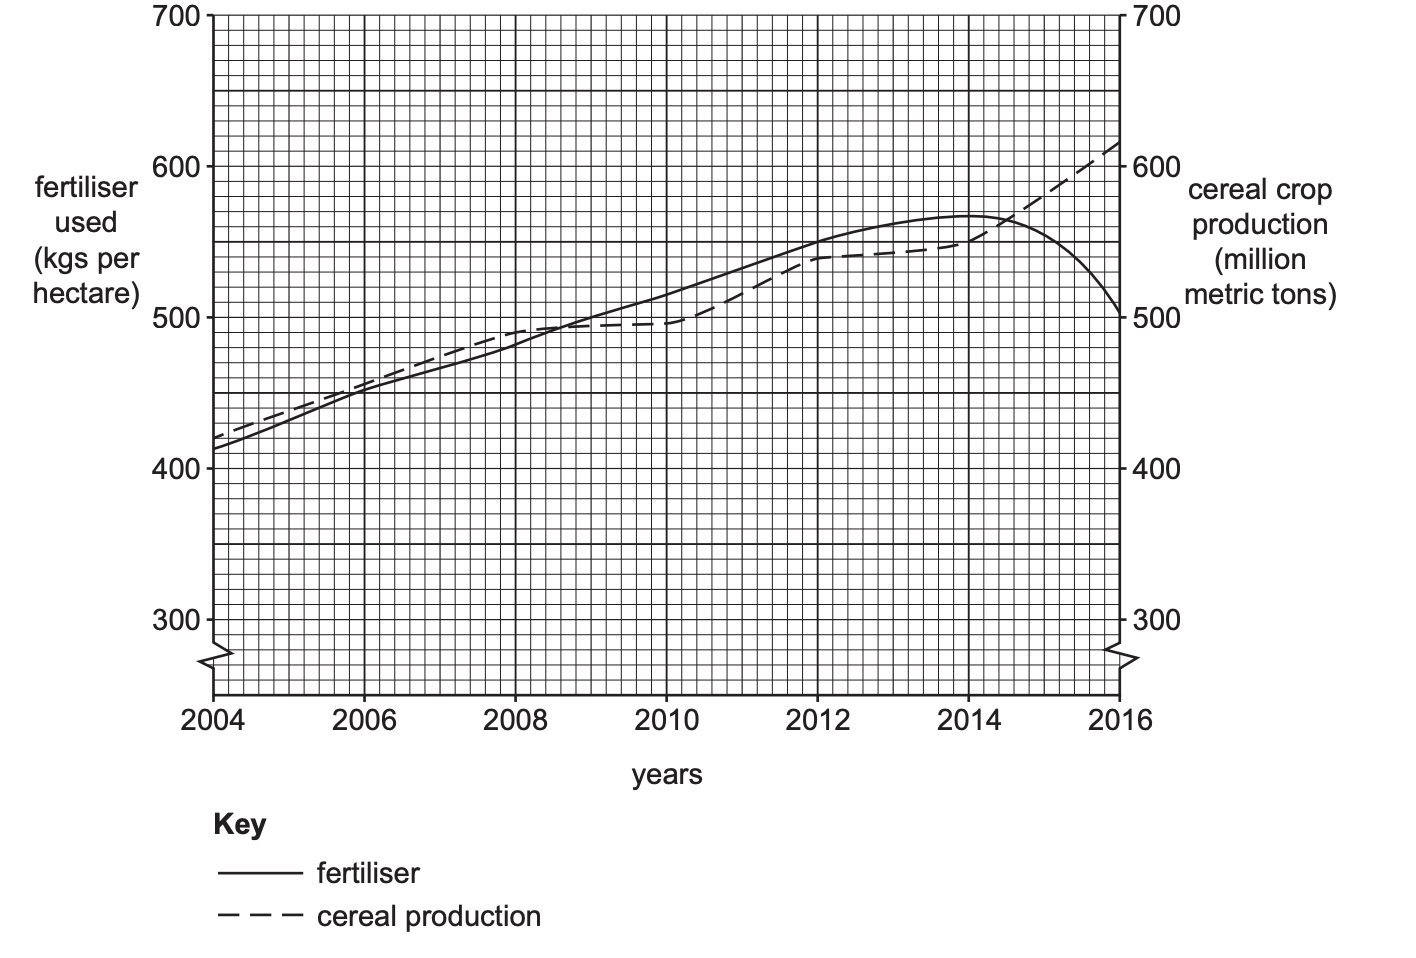
Fig. 5.1 shows information about fertiliser use and cereal crop production in part of China.

Graph showing fertiliser use and cereal crop production from 2004 to 2016. Fertiliser use rises steadily; crop production fluctuates, peaking around 2014.
Fig 5.1

What was the amount of cereal crop production in 2014?

4b3 marks

Describe the relationship between fertiliser use and cereal crop production shown in Fig. 5.1.

5a3 marks

Fig. 5.2 describes an agricultural project which has been introduced in part of China.

Text describing a project involving Chinese farmers reducing fertiliser use by 1.2 million tons, preventing water pollution and saving $12.2 billion.
Fig 5.2

Use evidence from Fig. 5.2 to show that this is a good example of sustainable agriculture.

5b1 mark

Suggest one reason why it might be difficult for some LICs to undertake this type of project.