Bar Charts (Edexcel IGCSE Maths B): Revision Note
Exam code: 4MB1

Bar charts
What is a bar chart?
A bar chart is a visual way to represent discrete data
Discrete data is data that can be counted
This can be numerical like shoe sizes in a class
Or non-numerical (categorical) like colours of cars down a road
The horizontal axis shows the different outcomes
The vertical axis shows the frequency
The heights of the bars show the frequency
Bars should be separated by gaps
Bars should have equal widths
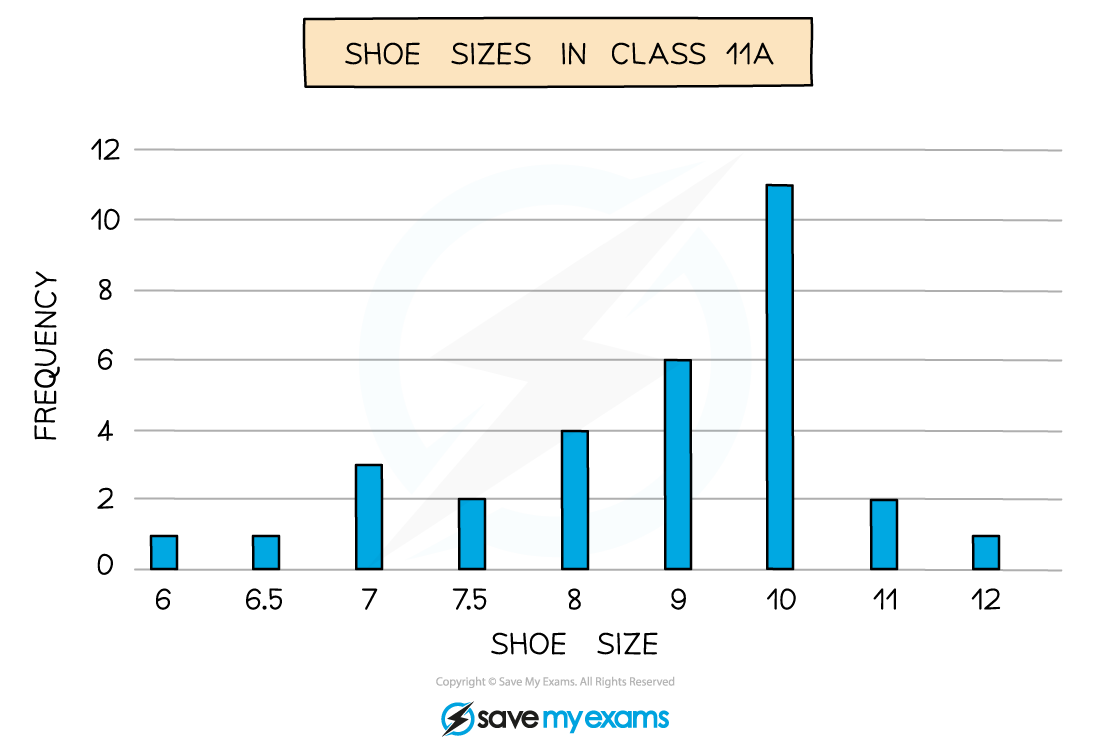
The mode is the outcome with the highest bar
Examiner Tips and Tricks
If you need to find the median for data given in a bar chart
Turn the data from the bar chart into a table
Then use the method for finding the median in the 'Averages from Tables' revision note
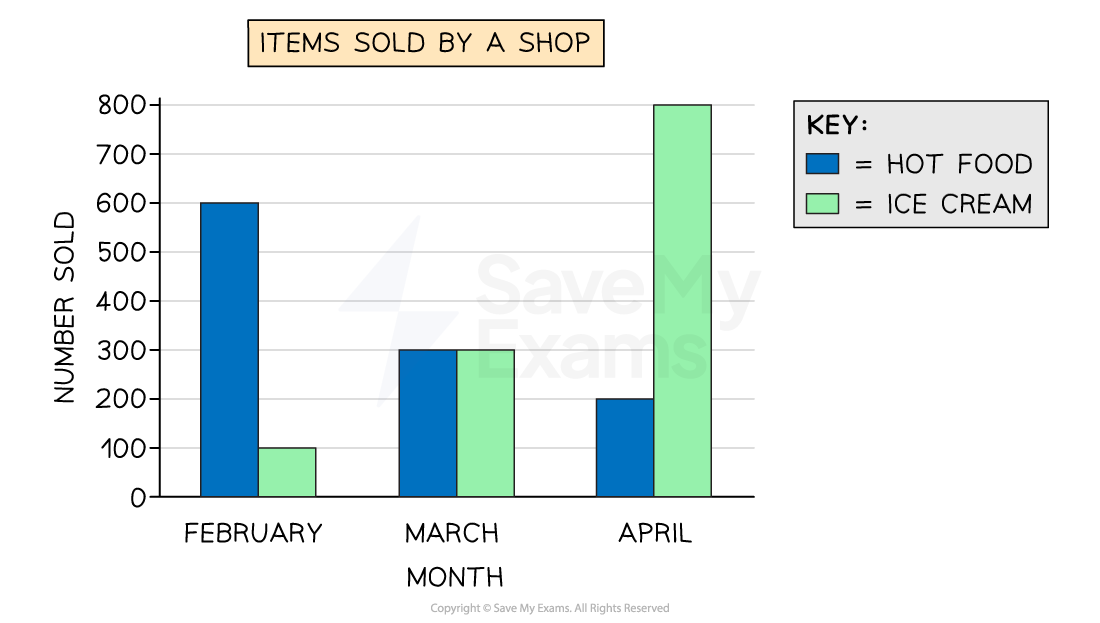
You can also get dual bar charts to compare two data sets
Bars are in pairs (side-by-side) for each outcome
Examiner Tips and Tricks
If asked to draw a bar chart, find the largest frequency and choose a scale which allows that to fit in the space provided.
Worked Example
Mr Barr teaches students in Year 7 and Year 8.
He records the number of pets that students in each year have.
His results are shown below.
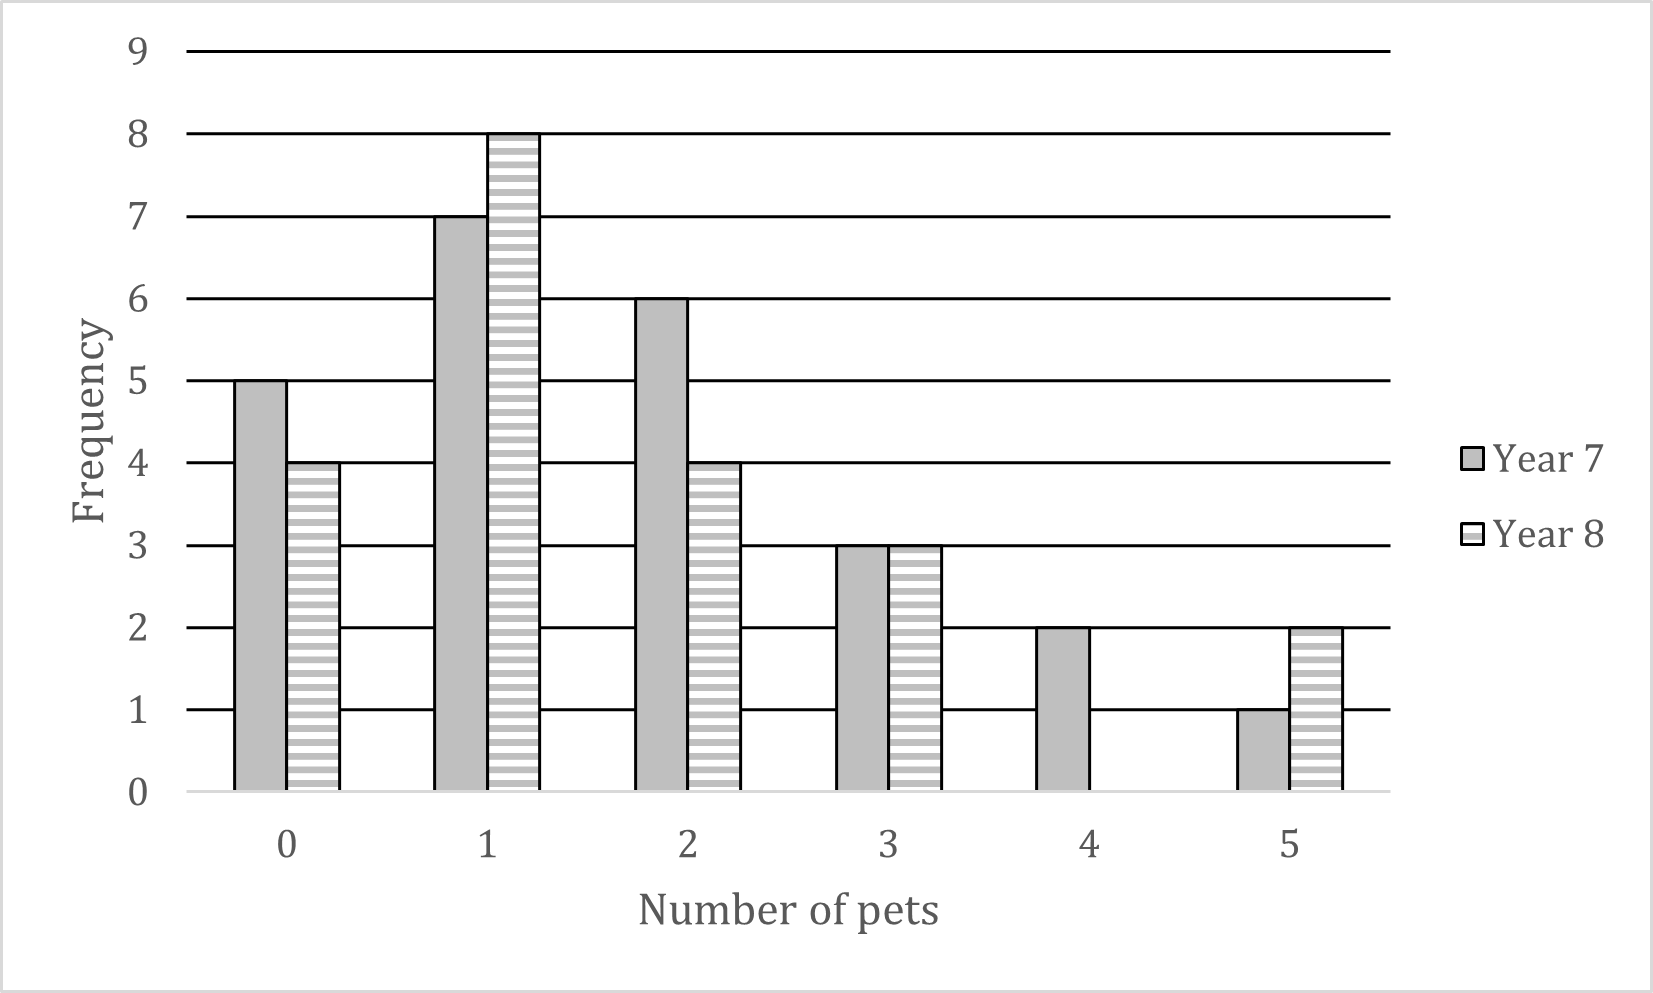
(a) Write down the modal number of pets for his Year 7 students.
Answer:
The modal number (mode) is the number of pets that occurs the most
Visually, this will be the highest bar for Year 7s
The mode for Year 7 is 1 pet
(b) How many Year 8 students does he teach?
Answer:
Add up all the heights (frequencies) of the Year 8 bars
4 + 8 + 4 + 3 + 0 + 2
He teaches 21 Year 8 students

Unlock more, it's free!
Join the 100,000+ Students that ❤️ Save My Exams
the (exam) results speak for themselves:

Was this revision note helpful?
