Solving Equations from Graphs (Edexcel IGCSE Maths B): Revision Note
Exam code: 4MB1

Solving equations using graphs
How do I find the coordinates of points of intersection?
Plot two graphs on the same set of axes
The points of intersection are where the two lines meet
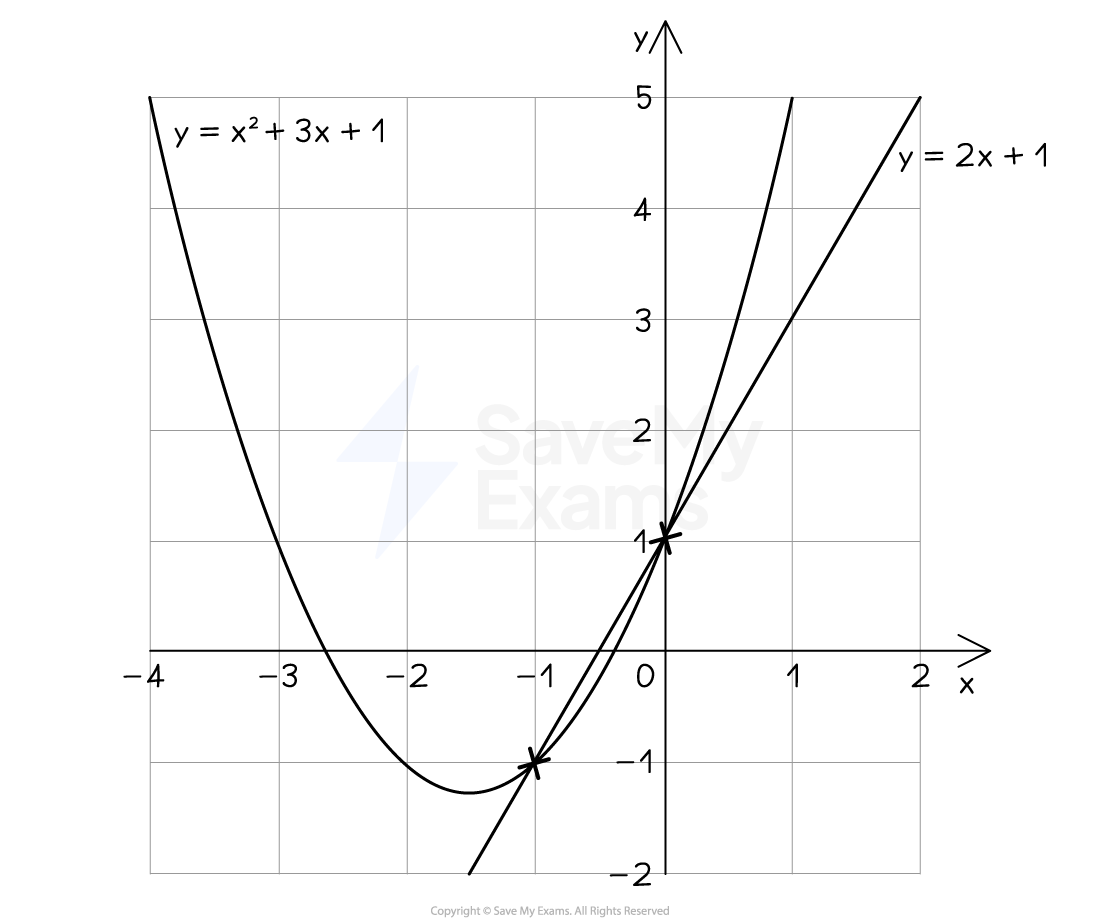
For example, plot y = x2 + 3x + 1 and y = 2x + 1 on the same axes
They meet twice, as shown
The coordinates of intersection are (-1, -1) and (0, 1)
How do I solve simultaneous equations graphically?
The x and y solutions to simultaneous equations are the x and y coordinates of the point of intersection
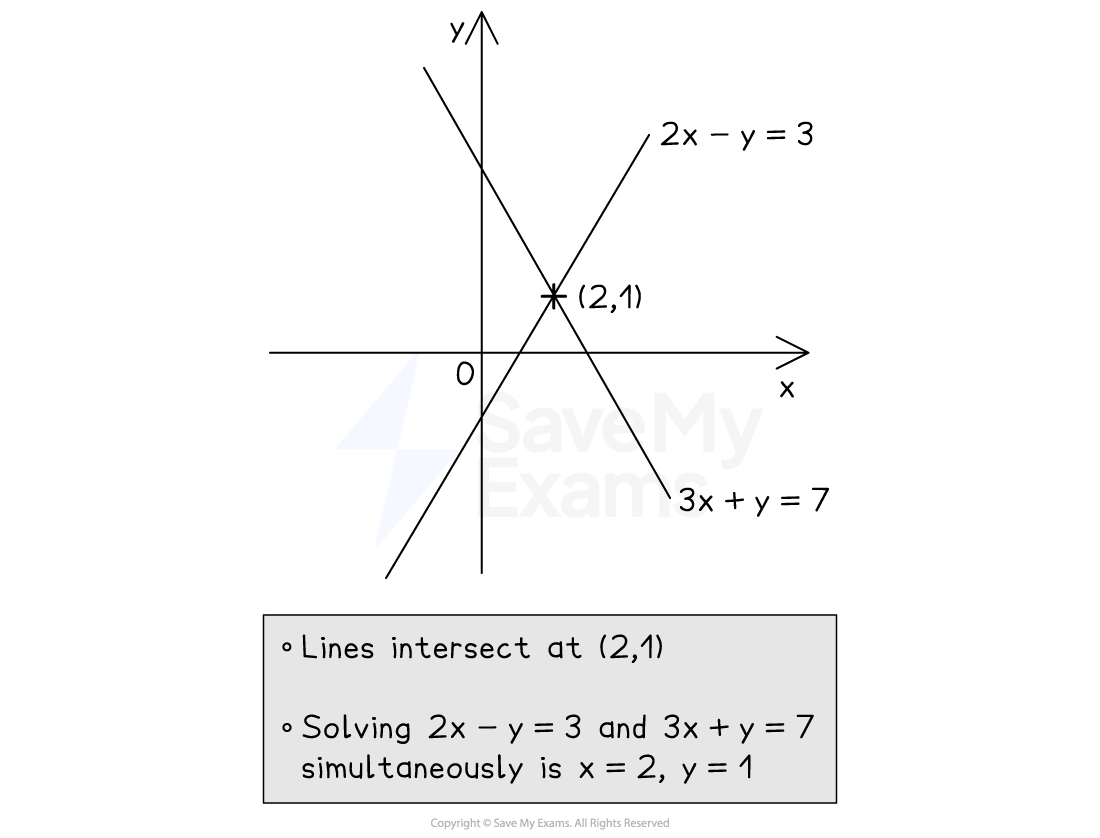
For example, to solve 2x - y = 3 and 3x + y = 7 simultaneously
Rearrange them into the form y = mx + c
y = 2x - 3 and y = -3x + 7
Use a table of values to plot each line
Find the point of intersection, (2, 1)
The solutions are therefore x = 2 and y = 1
How do I use graphs to solve equations?
This is easiest explained through an example
You can use the graph of to solve the following equations
The solutions are the two x-intercepts
This is where the curve cuts the x-axis (also called roots)
The solutions are the two x-coordinates where the curve intersects the horizontal line
The solutions are the two x-coordinates where the curve intersects the straight line
The straight line must be plotted on the same axes first
To solve a different equation like , if you are already given the graph of an equation, e.g.
add / subtract terms to both sides to get "given graph = ..."
For example, subtract 5 from both sides
You can now draw on the horizontal line and find the x-coordinates of the points of intersection
Examiner Tips and Tricks
When solving equations in x, only give x-coordinates as final answers.
Include the y-coordinates if solving simultaneous equations.
Worked Example
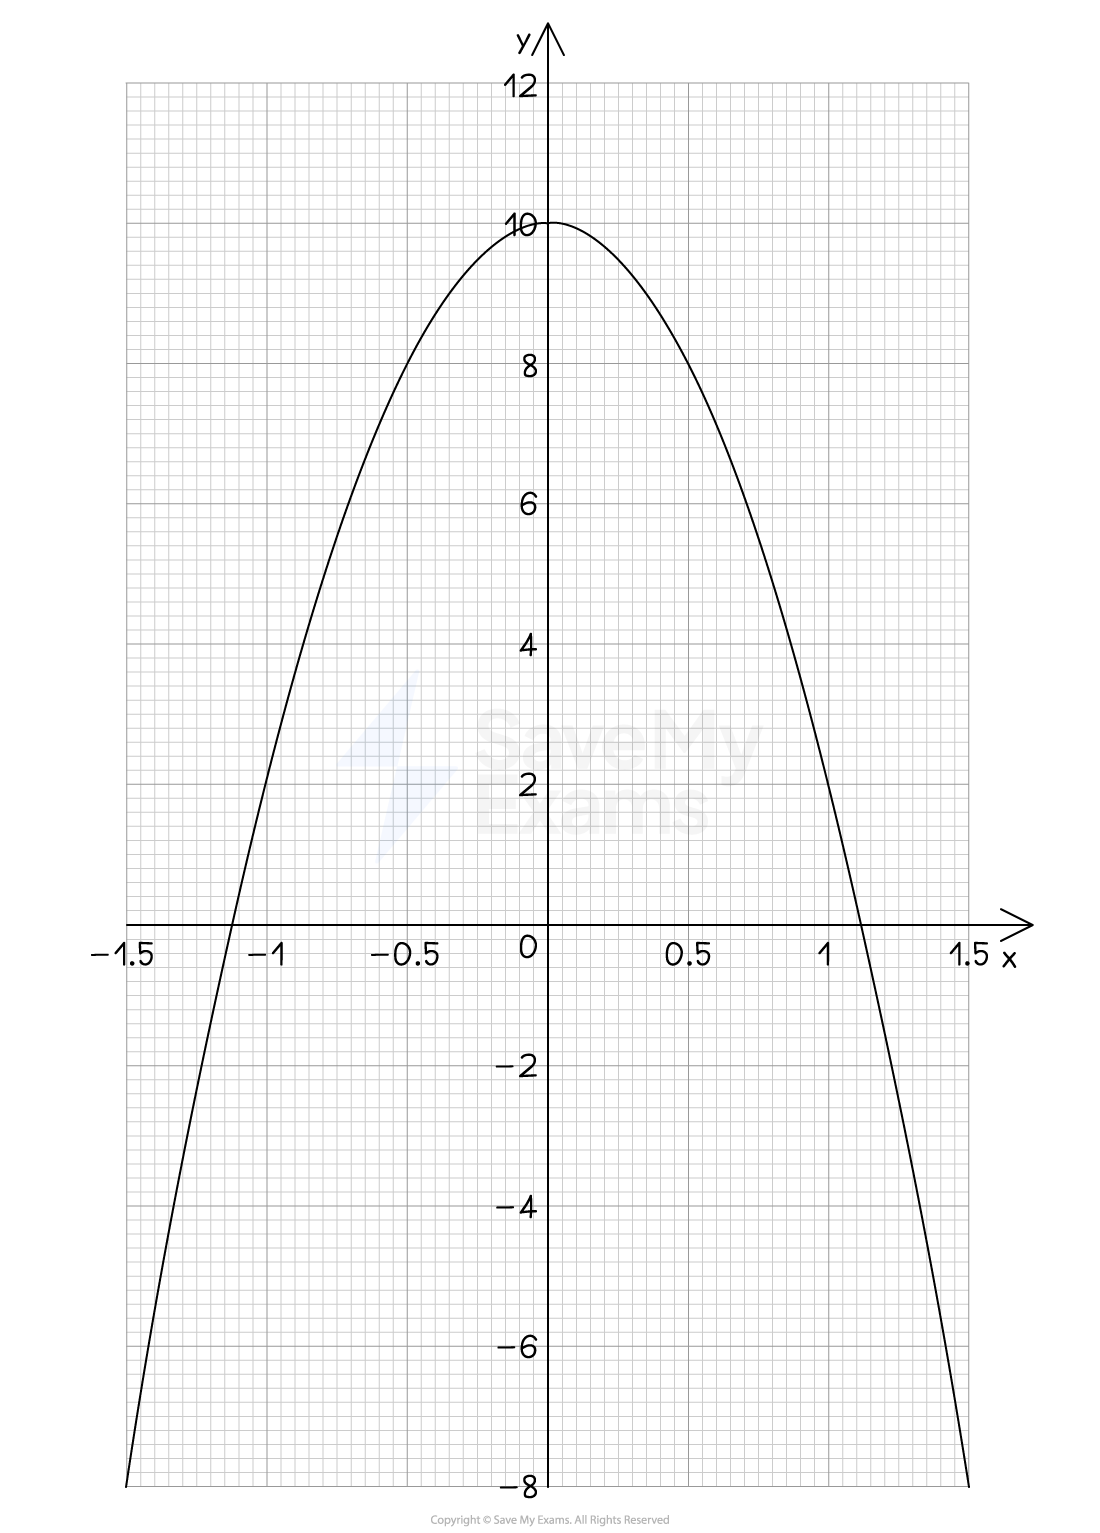
Use the graph of shown to estimate the solutions of each equation given below.
(a)
Answer:
The function equals zero, so the x-intercepts of its graph are the solutions
Read off the values where the curve cuts the x-axis
Use a suitable level of accuracy (no more than 2 decimal places from the scale of this graph)
-1.12 and 1.12
These are the two solutions to the equation
x = -1.12 and x = 1.12
A range of solutions are accepted, such as "between 1.1 and 1.2"
Solutions must be ± of each other (due to the symmetry of quadratics)
(b)
Answer:
The function equals 8, so draw the horizontal line y = 8
Find the x-coordinates where this cuts the graph
-0.5 and 0.5
These are the two solutions to the original equation
x = -0.5 and x = 0.5
Worked Example
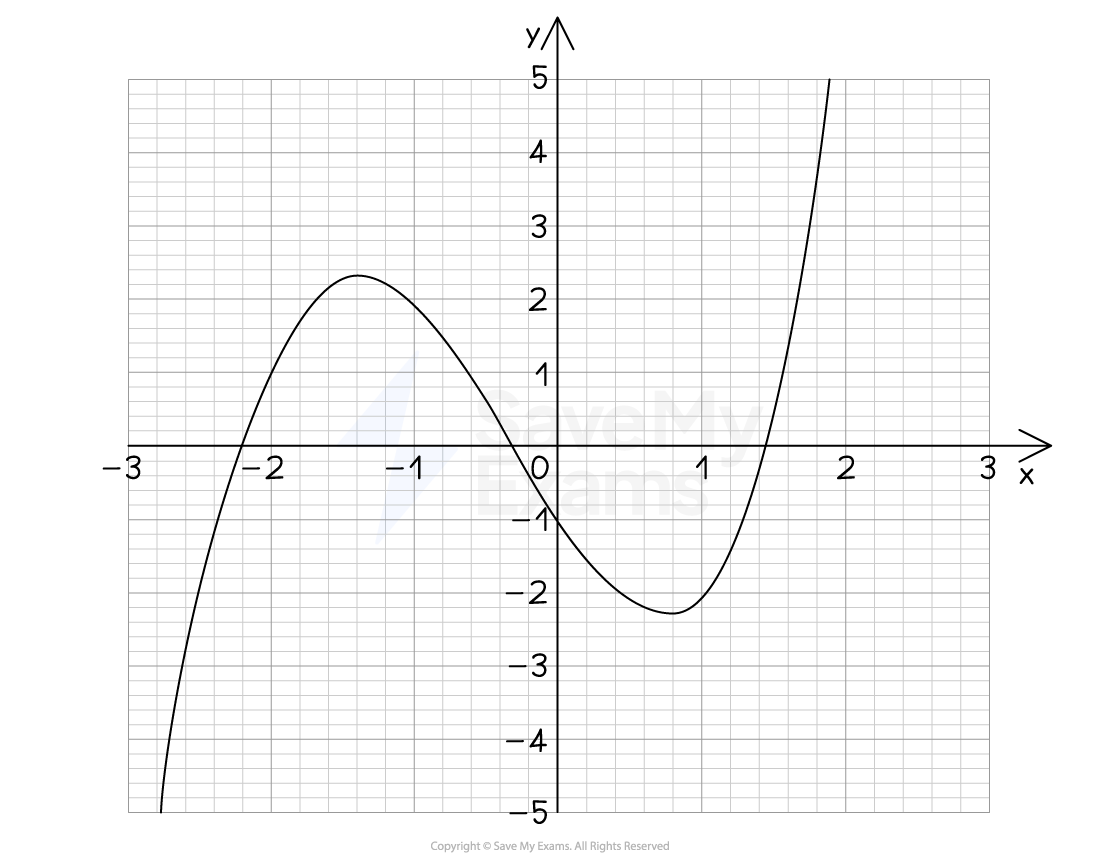
The graph of is shown below.
Use the graph to estimate the solutions of the equation .
Give your answers to 1 decimal place.
Answer:
We are given a different equation to the one plotted so we must rearrange it to , in this case
Now plot on the same axes
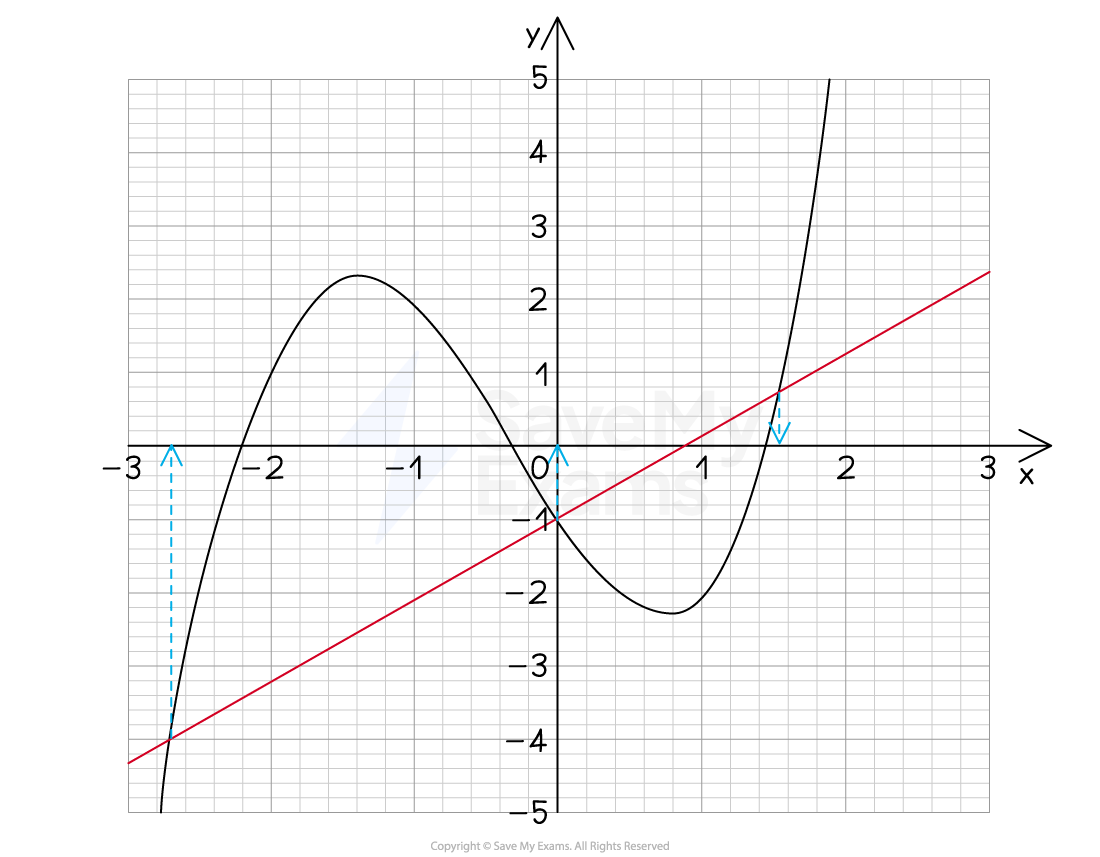
The solutions are the -coordinates of where the curve and the straight line intersect

Unlock more, it's free!
Join the 100,000+ Students that ❤️ Save My Exams
the (exam) results speak for themselves:

Was this revision note helpful?
Build on this topic
